Drawing with Light
Presented by: Olinger Architects, Feldman Surveyors, and Metropolitan Waterworks Museum
Presented at ABX | 2016 C27: VR 4 BIM
As a part of our research into immersive visualization, Olinger Architects teamed up with Feldman 3D and the Metropolitan Waterworks Museum in Chestnut Hill to produce a High Definition LIDAR scan of the historic Waterworks Pump House. Olinger Architects transformed the LIDAR point cloud scan into a series of 360 Equirectangular Panoramic studies that help to demonstrate some of LIDAR's potential for creating instant (raw data) immersive environments.
Process
Olinger Architects combined PTGui & Revit to generate the spherical panoramas in this post. The process to create these panoramas is simple, and requires a minor amount of tedium in the camera set up (40 views), but if you can handle a half hour of set up, you can experience hours of enlightened spatial experience. So here is how I hacked Revit to generate an equirectangular panoramic image of a LIDAR Point Cloud.
Challenge to be overcome:
Recent advances in mobile and cloud computing have made highly realistic and interactive 3D environments accessible to the general public. New visualization environments offered by Autodesk A360 and startups such as Modelo provide truly exceptional design visualization, but unfortunately, they have a massive blind spot when it comes to Point Cloud visualization. So how do we find a workaround for viewing our information rich point clouds in Revit? Simple, we use Revit's parametric camera settings to reverse engineer the inputs for a spherical panorama. Below is a step by step explanation for how to do it.

Figure #1: The base images for the Equirectangular Panorama are generated by parametric camera views that are batch exported using Revit's native image exporter.

Figure #2: Each view captures a discrete cone of vision that tiles into a spherical mosaic of view frames. Each of these frames has been saved to a folder for later access.

Figure #3: In this cutaway view we are able to see the positioning of the station-point relative to the other objects in the Engine Hall. PTGui identifies graphic features in each tile and blends them into an equirectangular panorama

Figure #4: A section through the Point Cloud scan illustrates the vertical range that corresponds to the view frame. For this study we used (40) Views, with (8) Views at the spherical equator, (8) at 40 degrees, (8) at 80 degrees, with (16) views covering the inverse lower hemisphere, for (4) total views.

Figure #5: In this equirectangular projection we are able to see the view range that is provided by a single view tile.
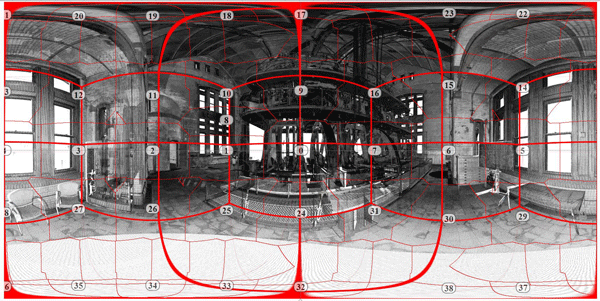
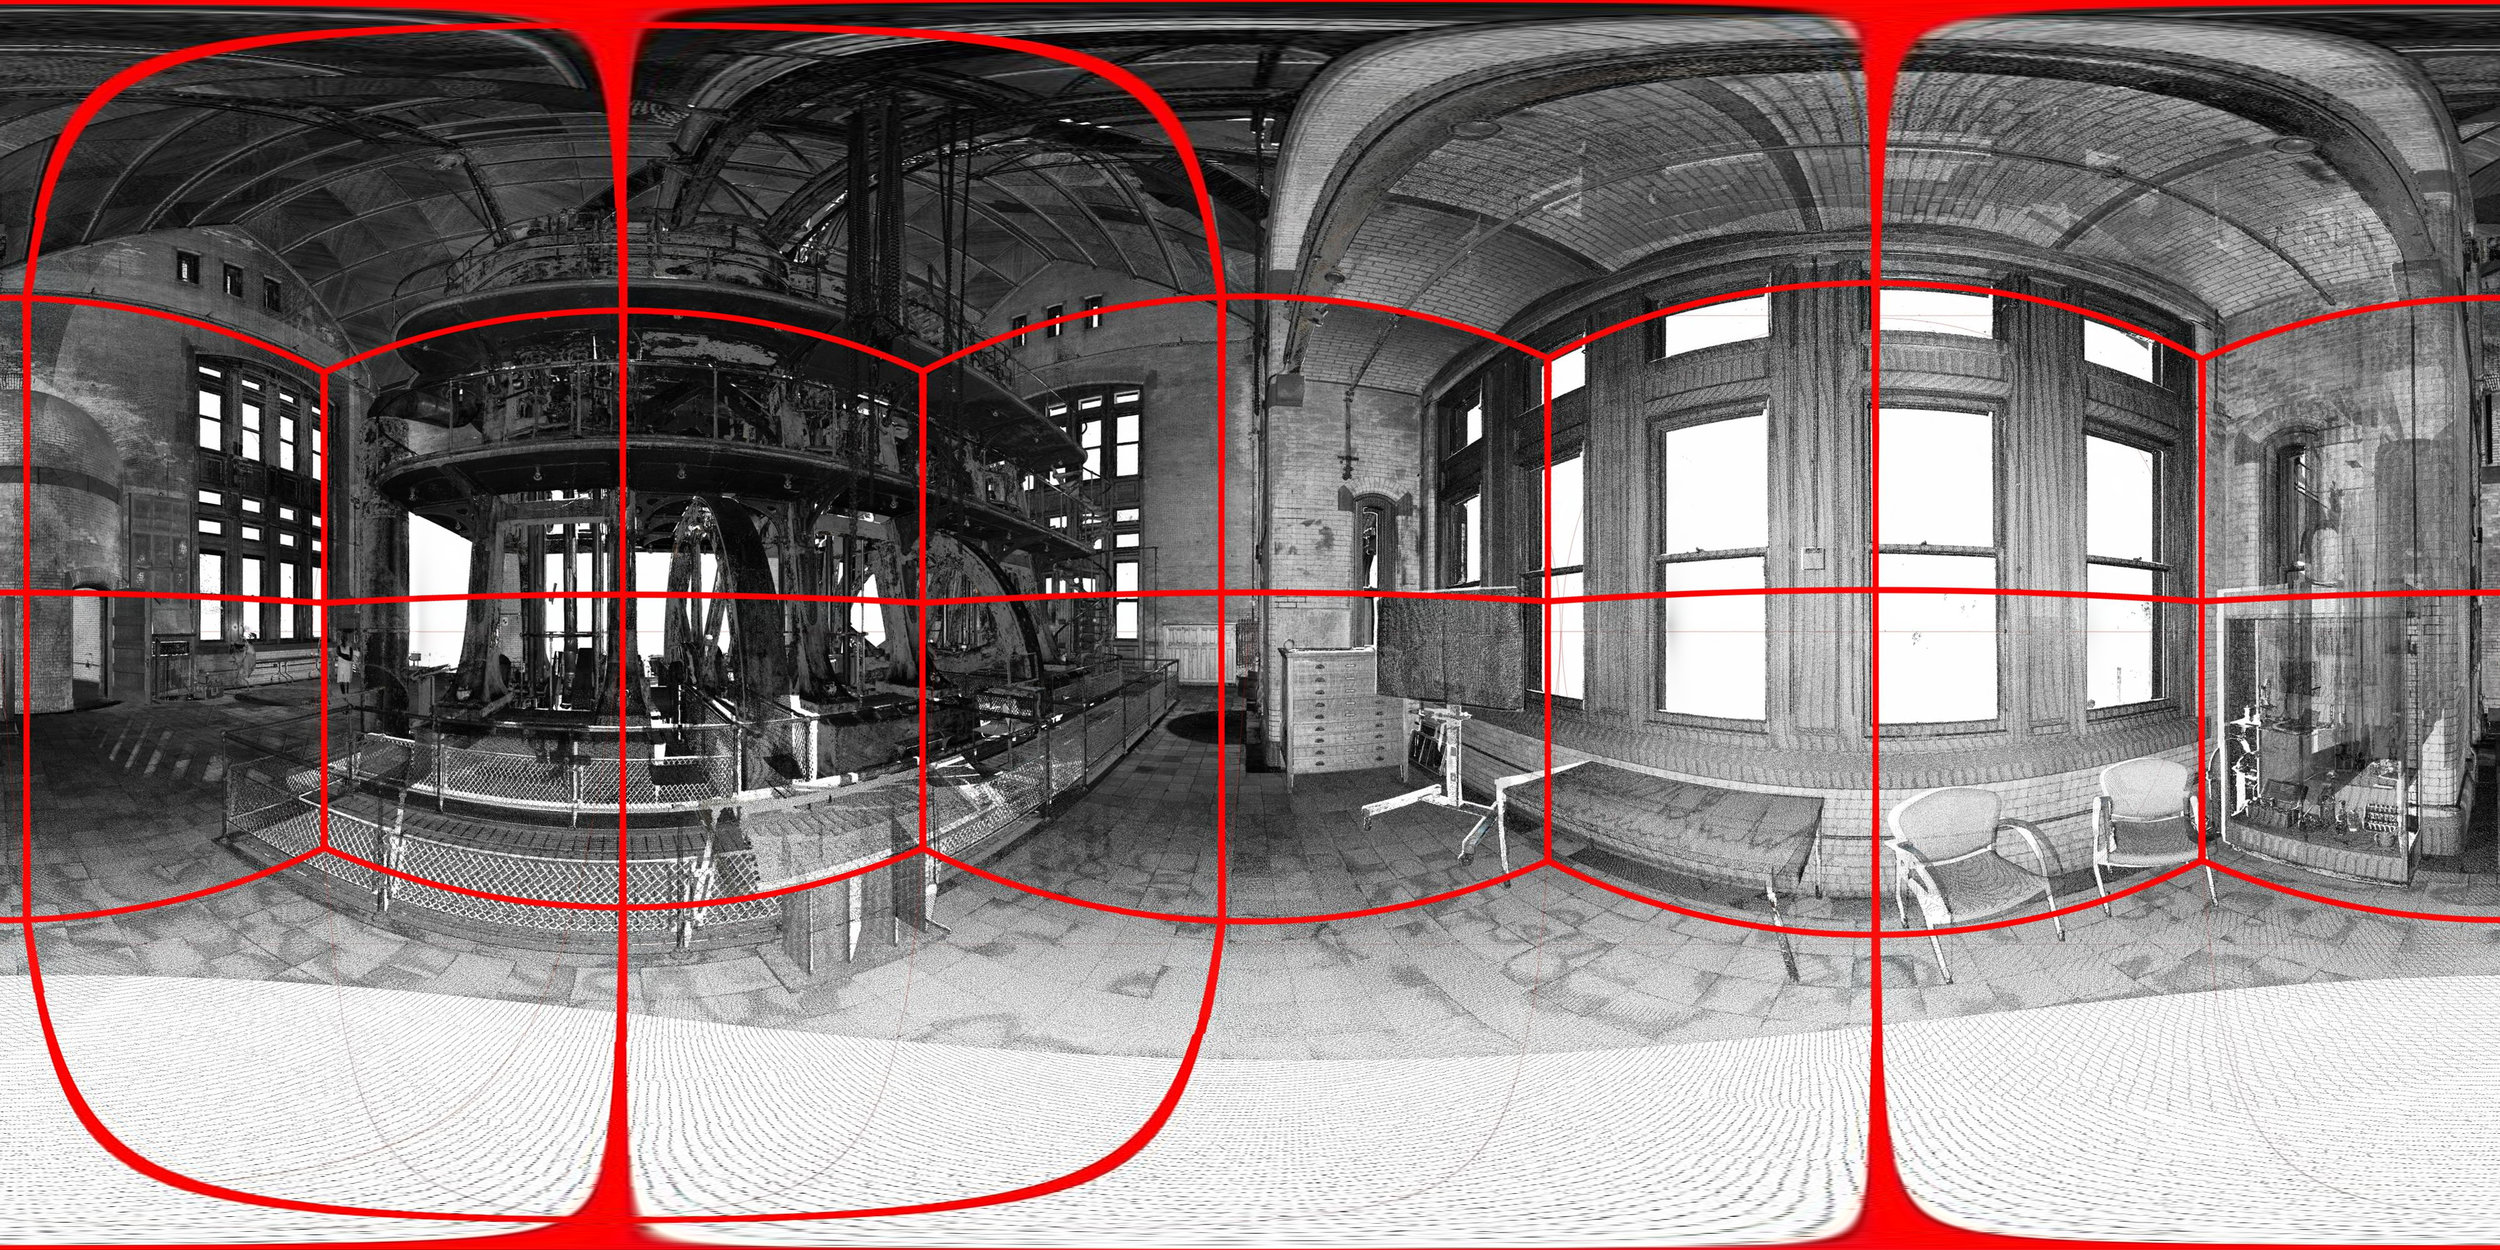
Figure #6: The assembled composite panorama depicts the station point cube shown in Figures 3 & 4, with the border region of the assembled view tiles shown in the finer red line.
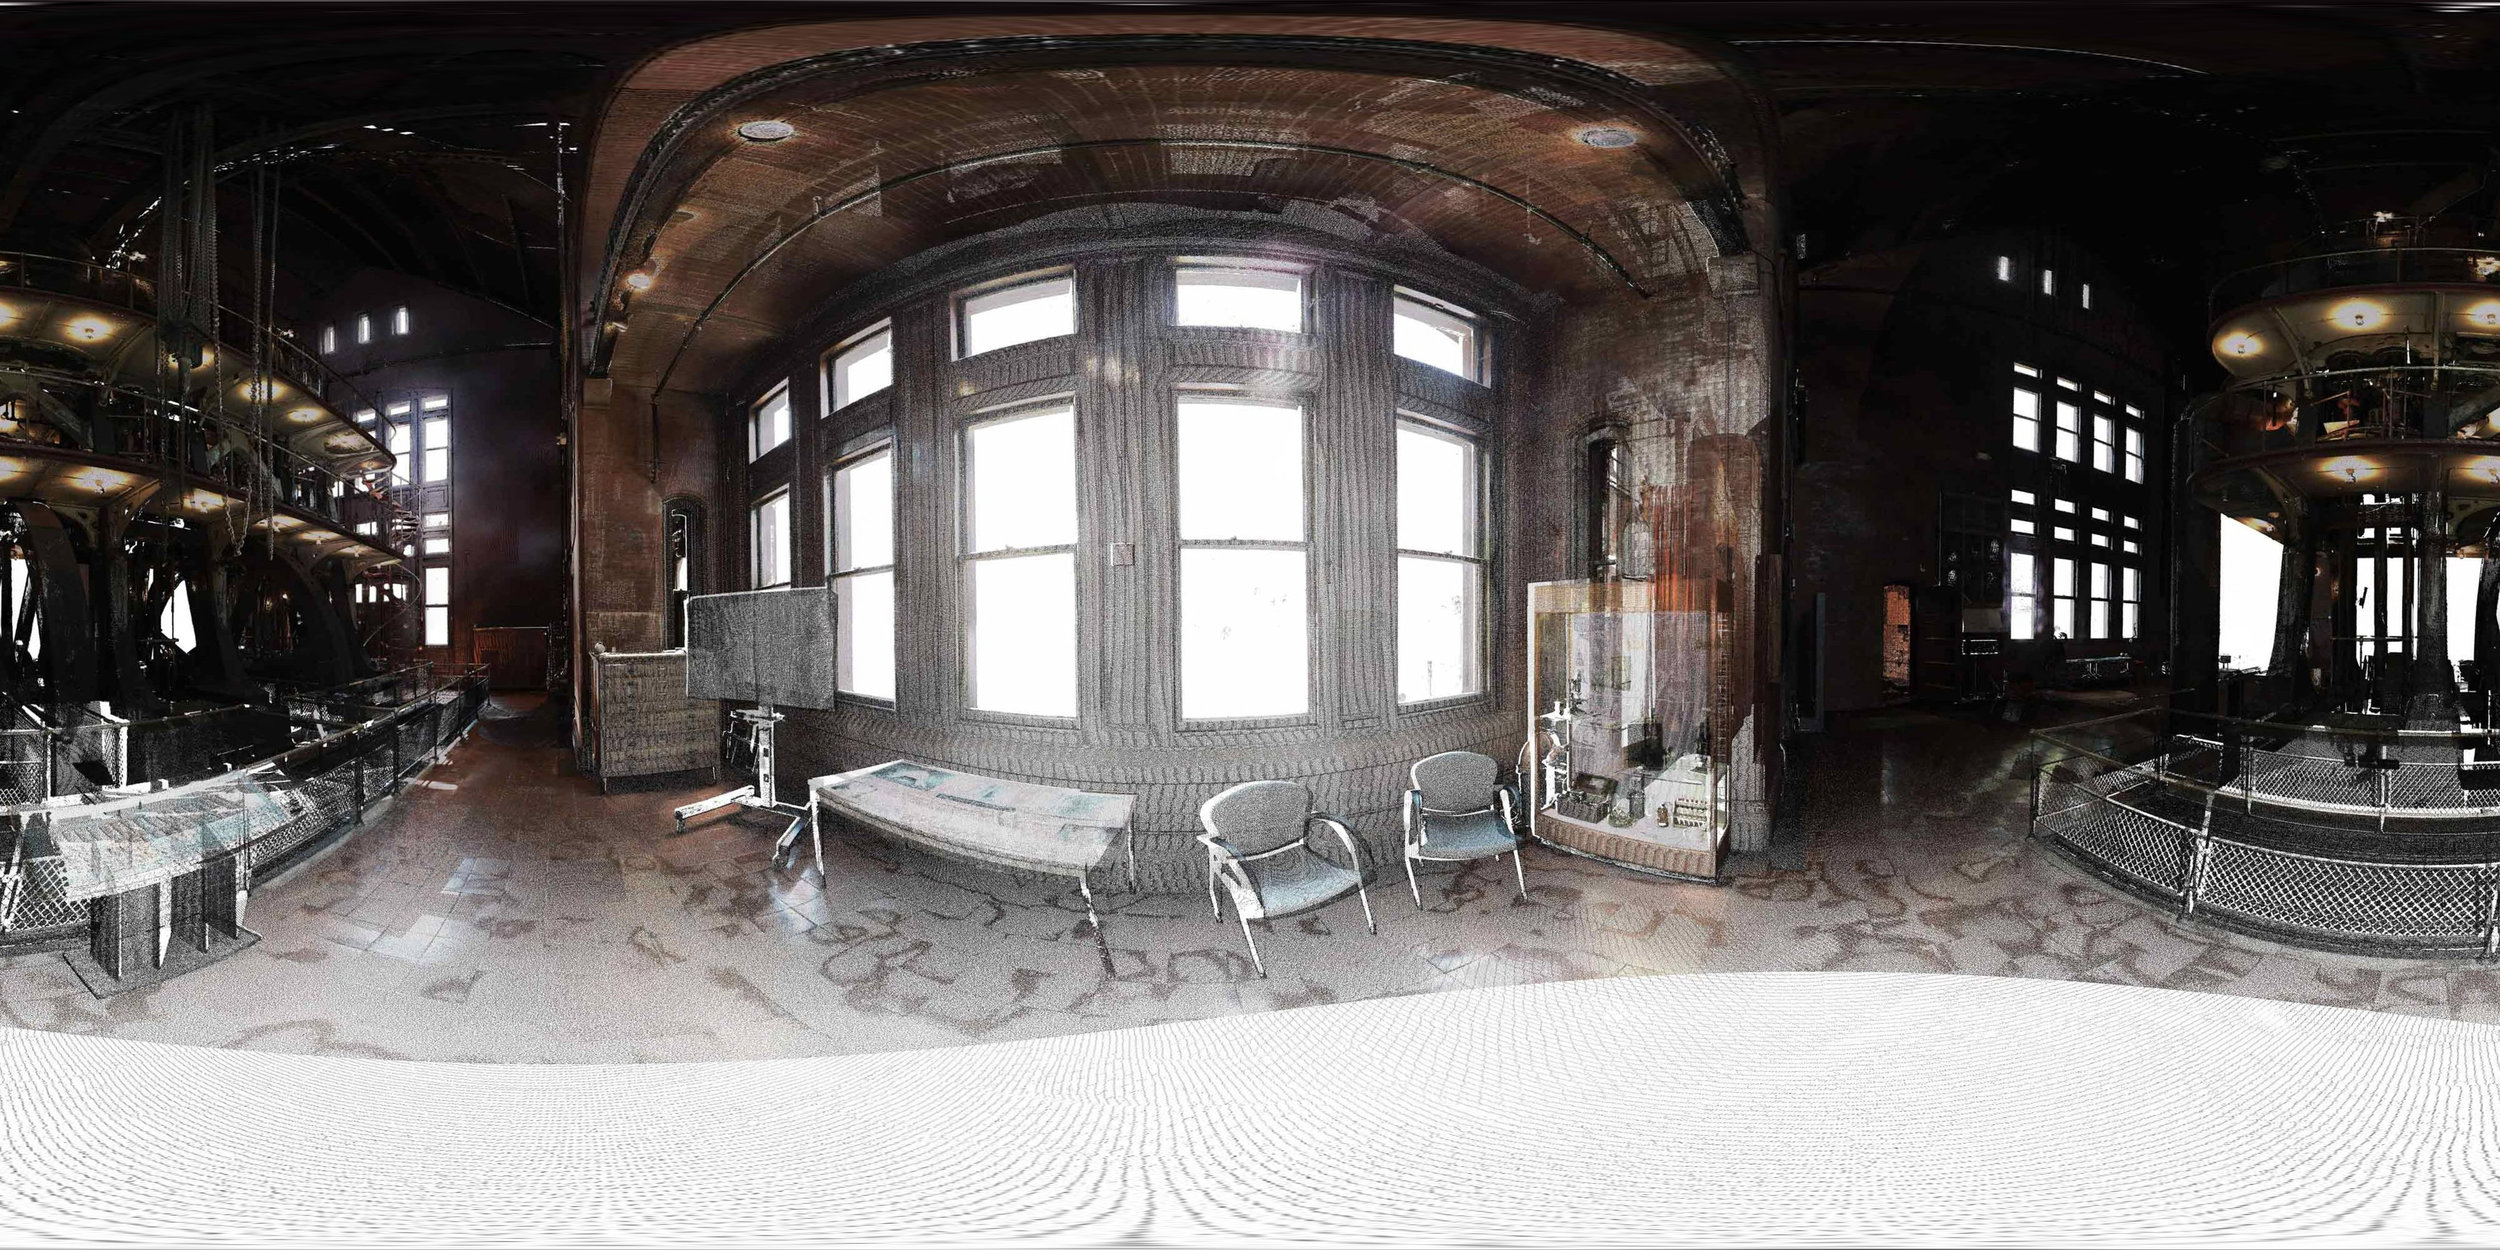
Figure #7: Compiled equirectangular panorama in a spherical
High Definition LIDAR Scan
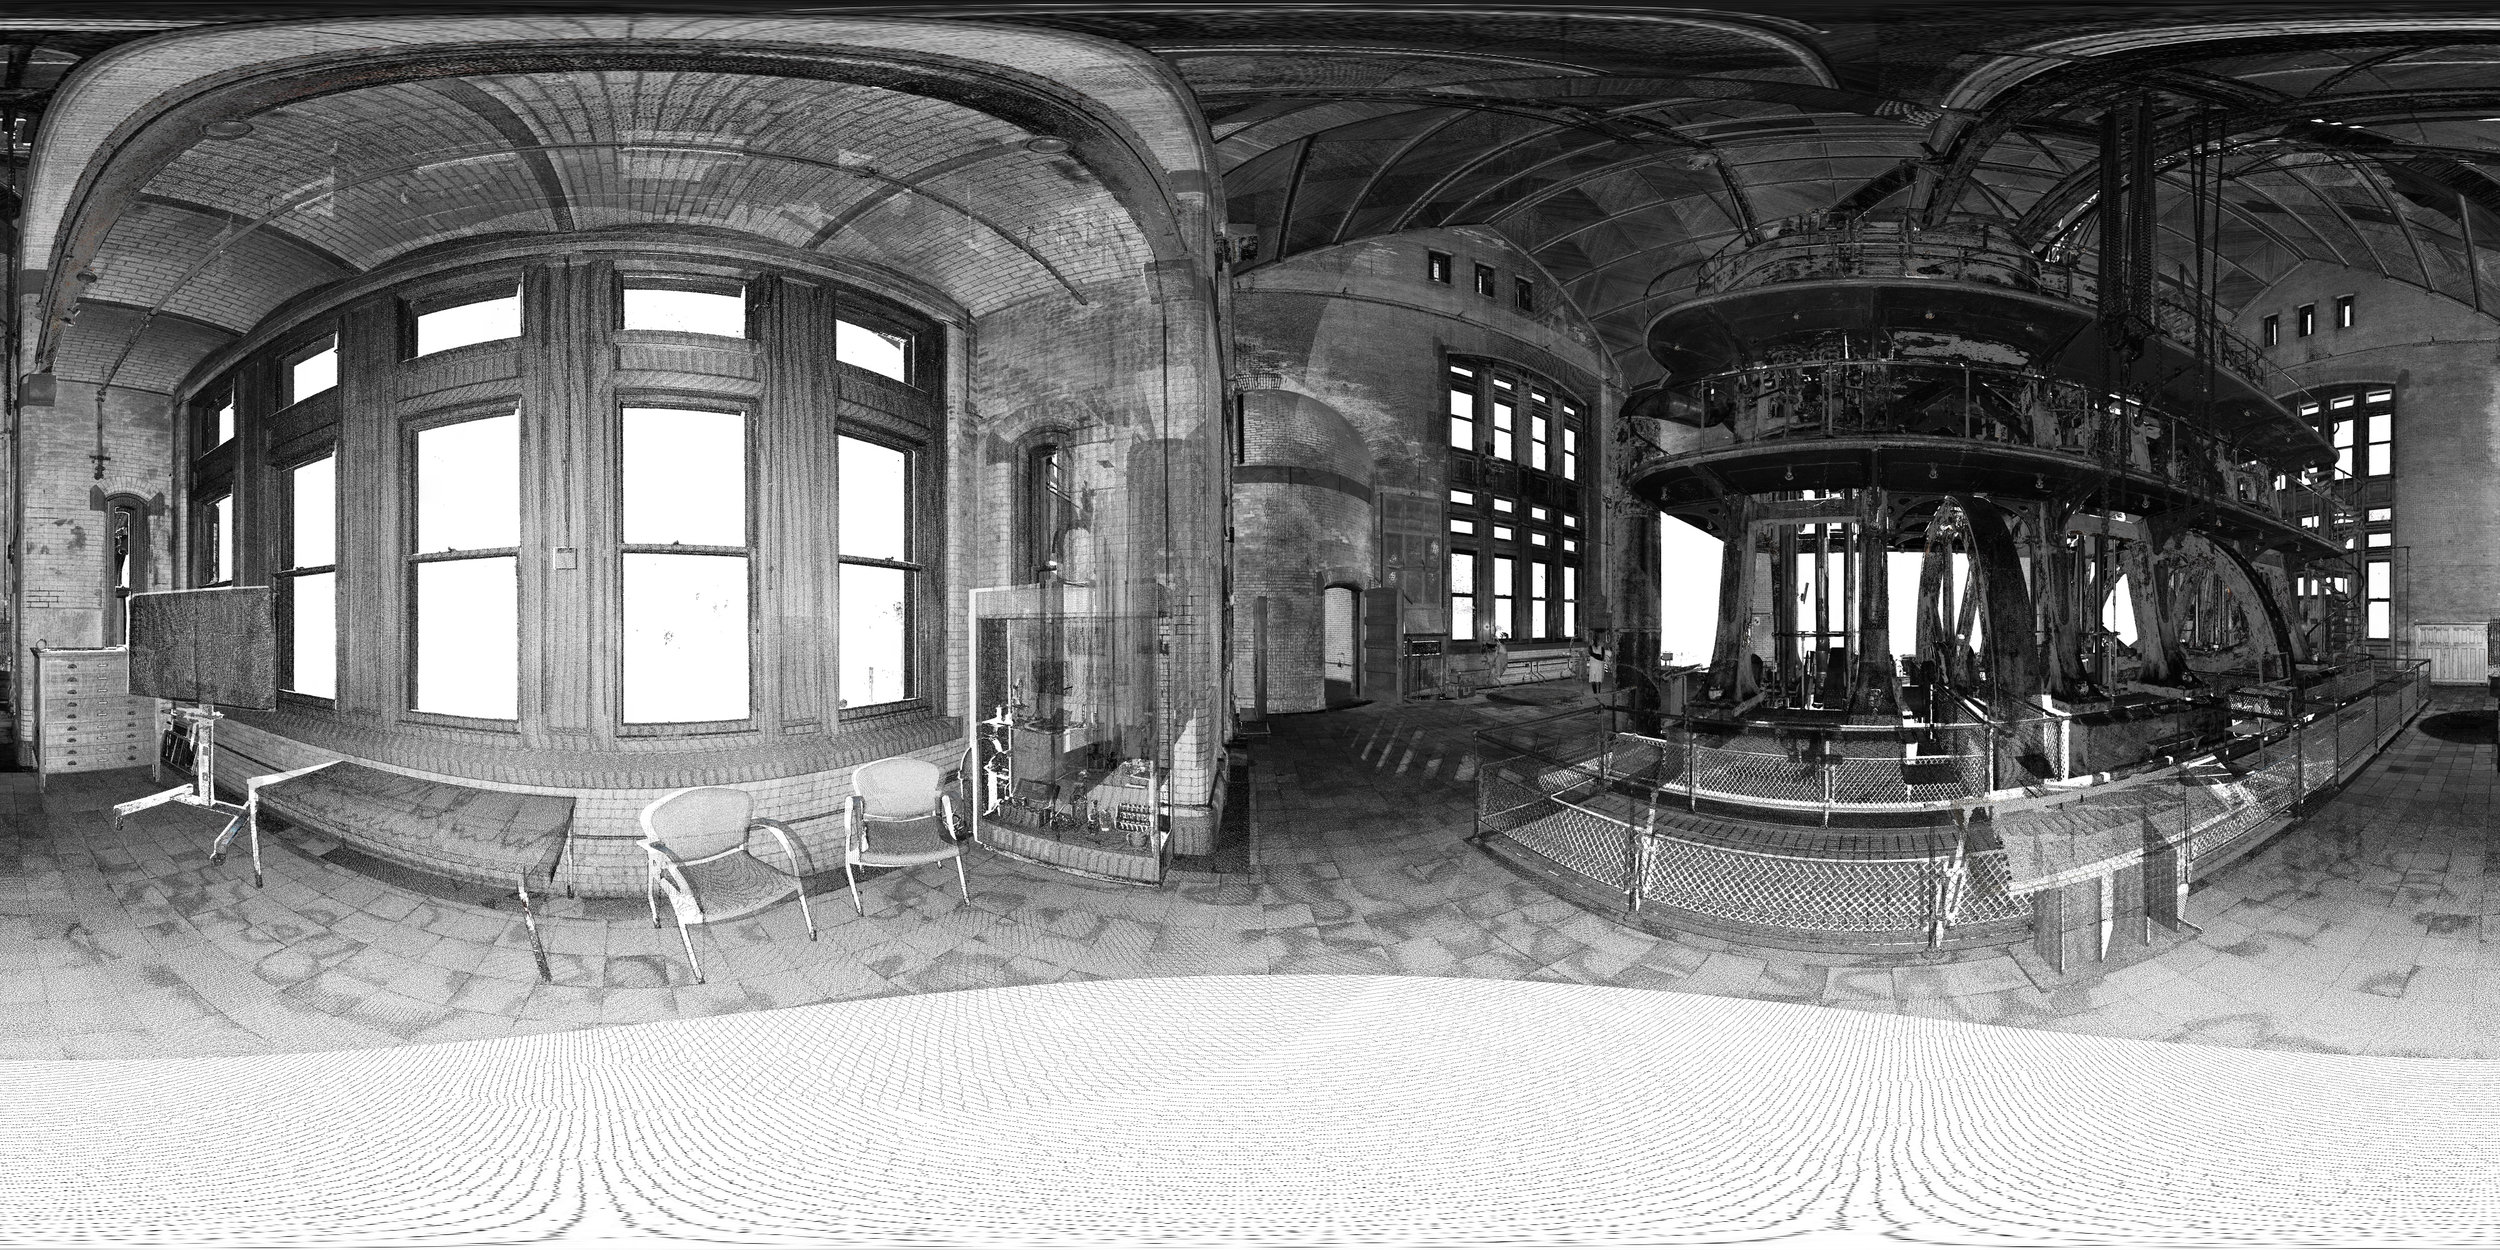
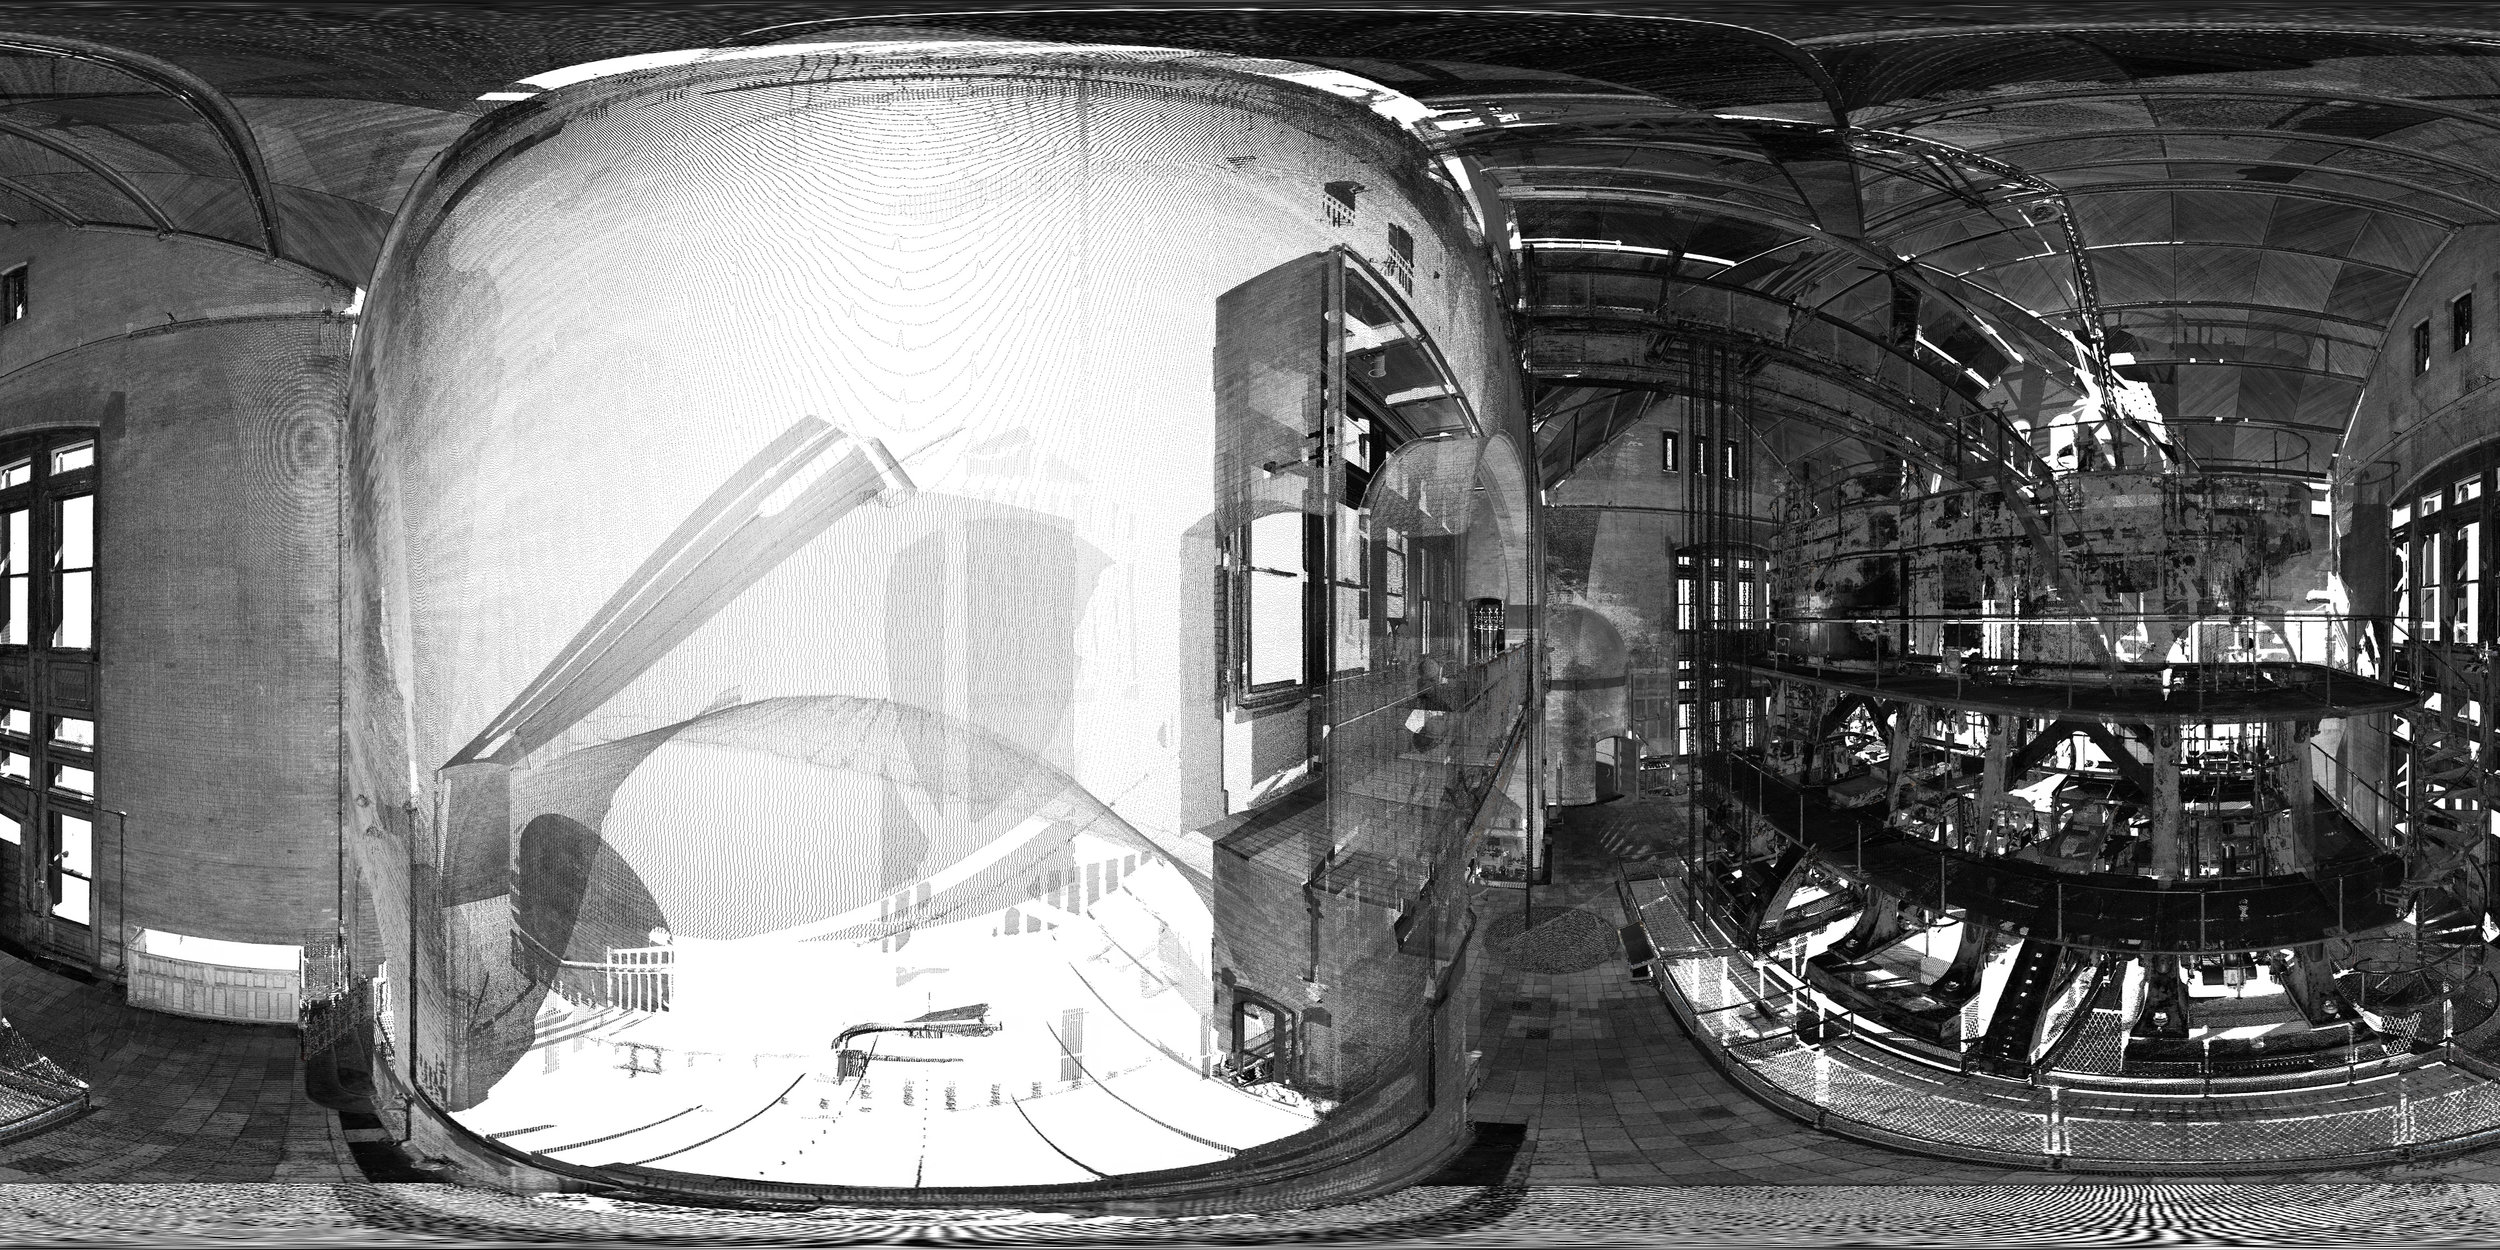
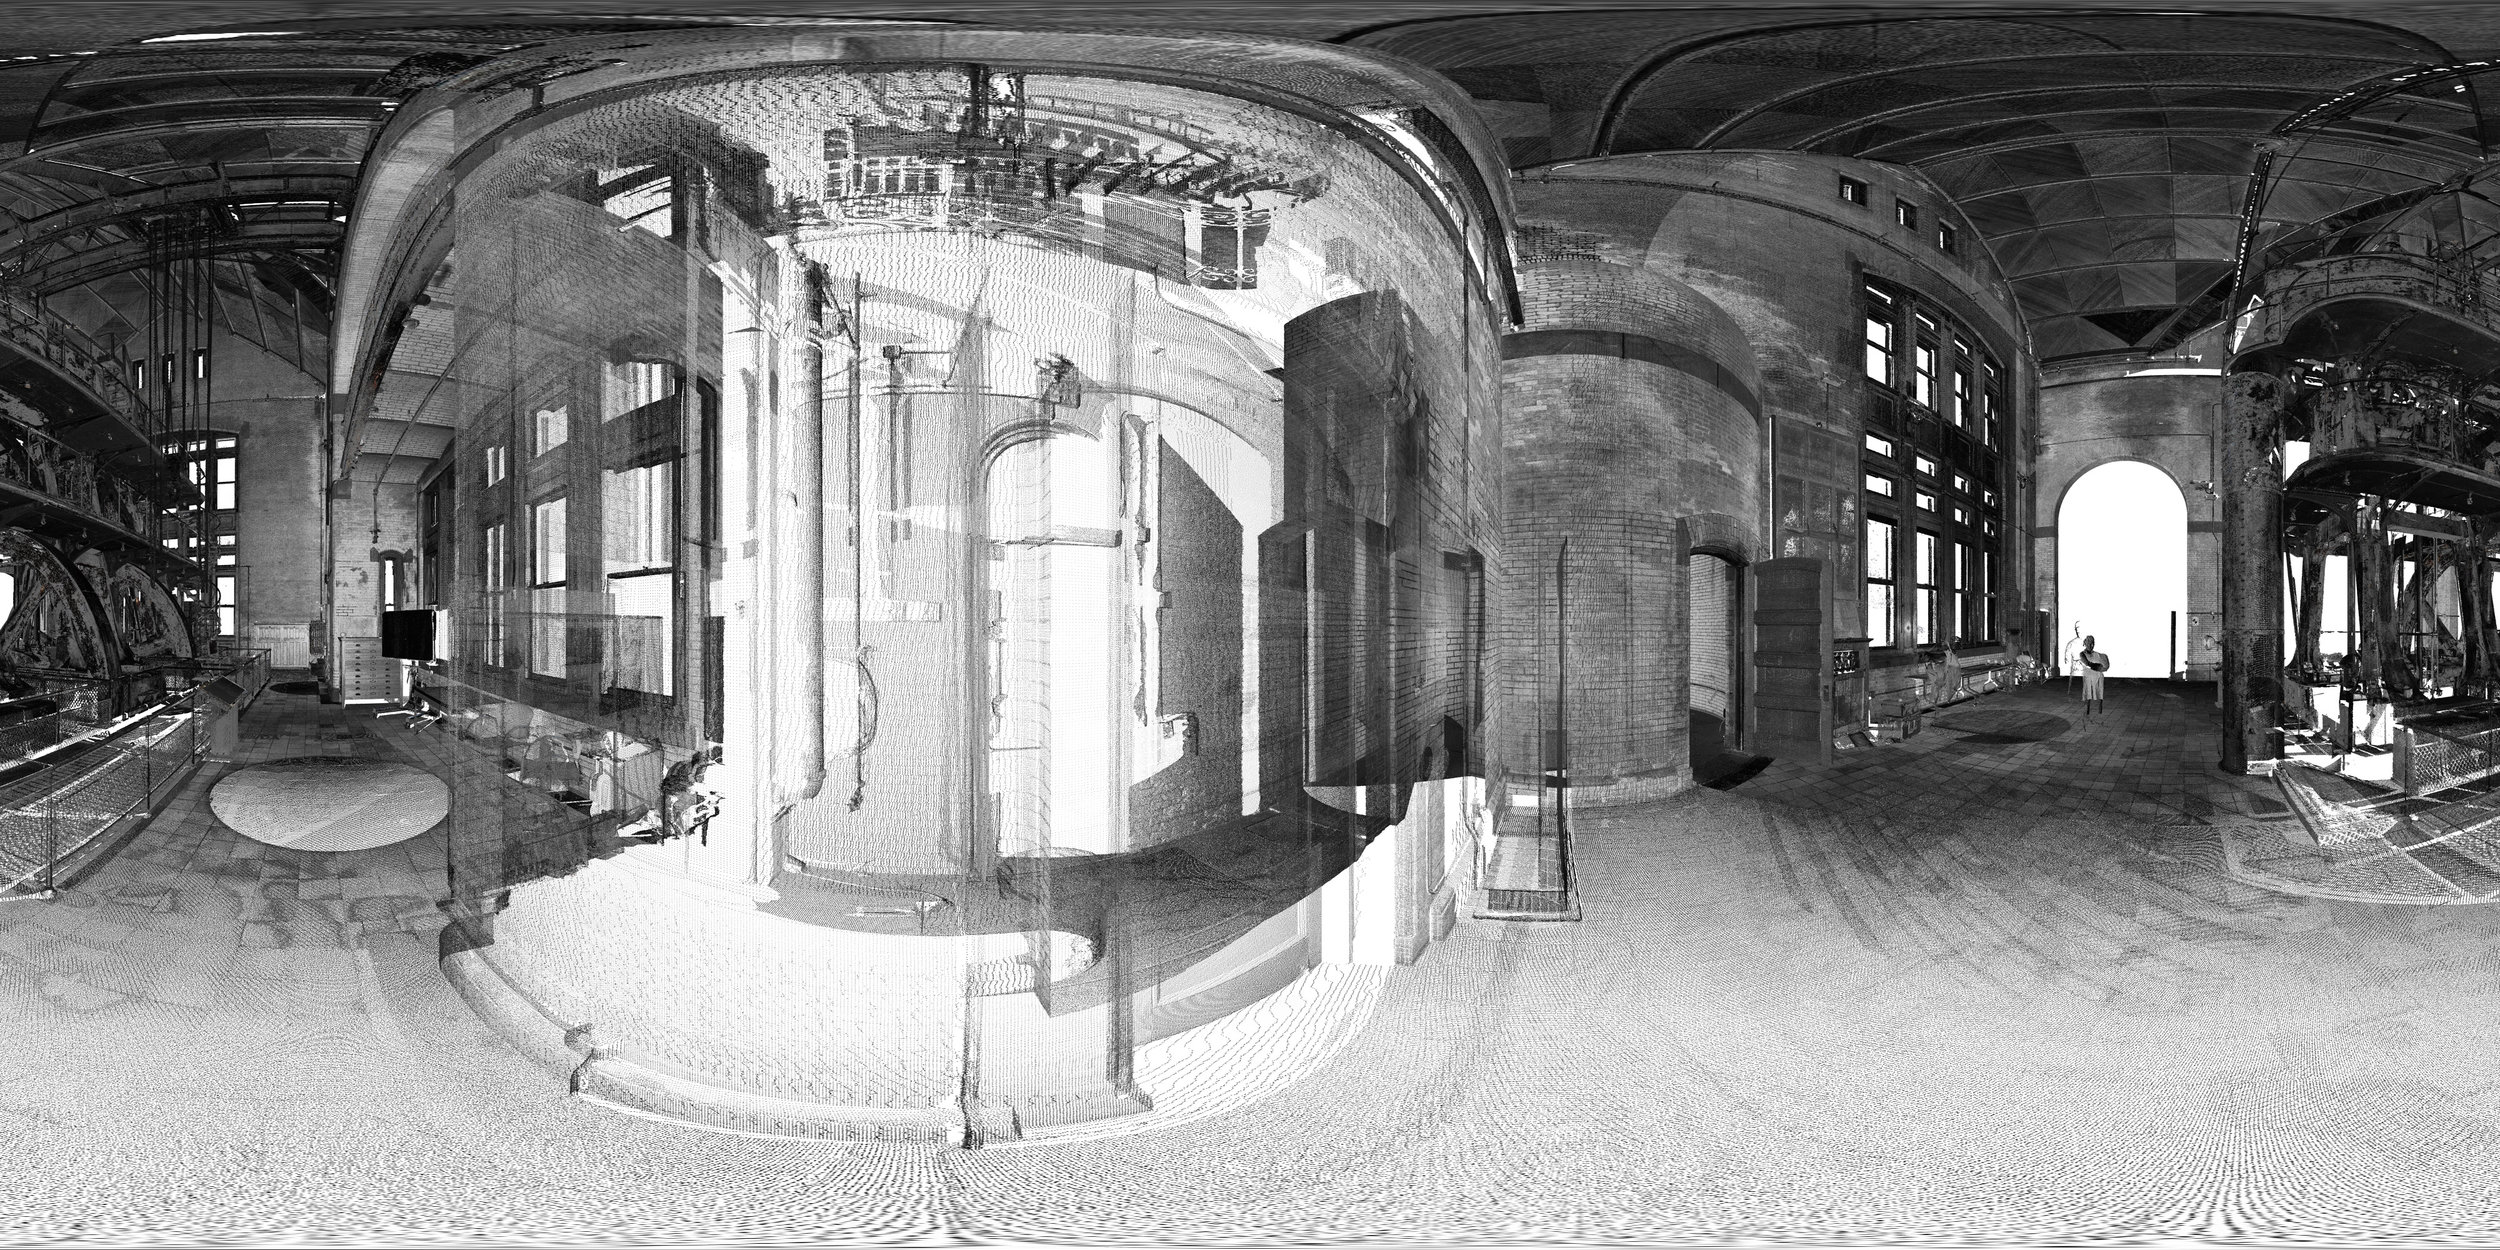
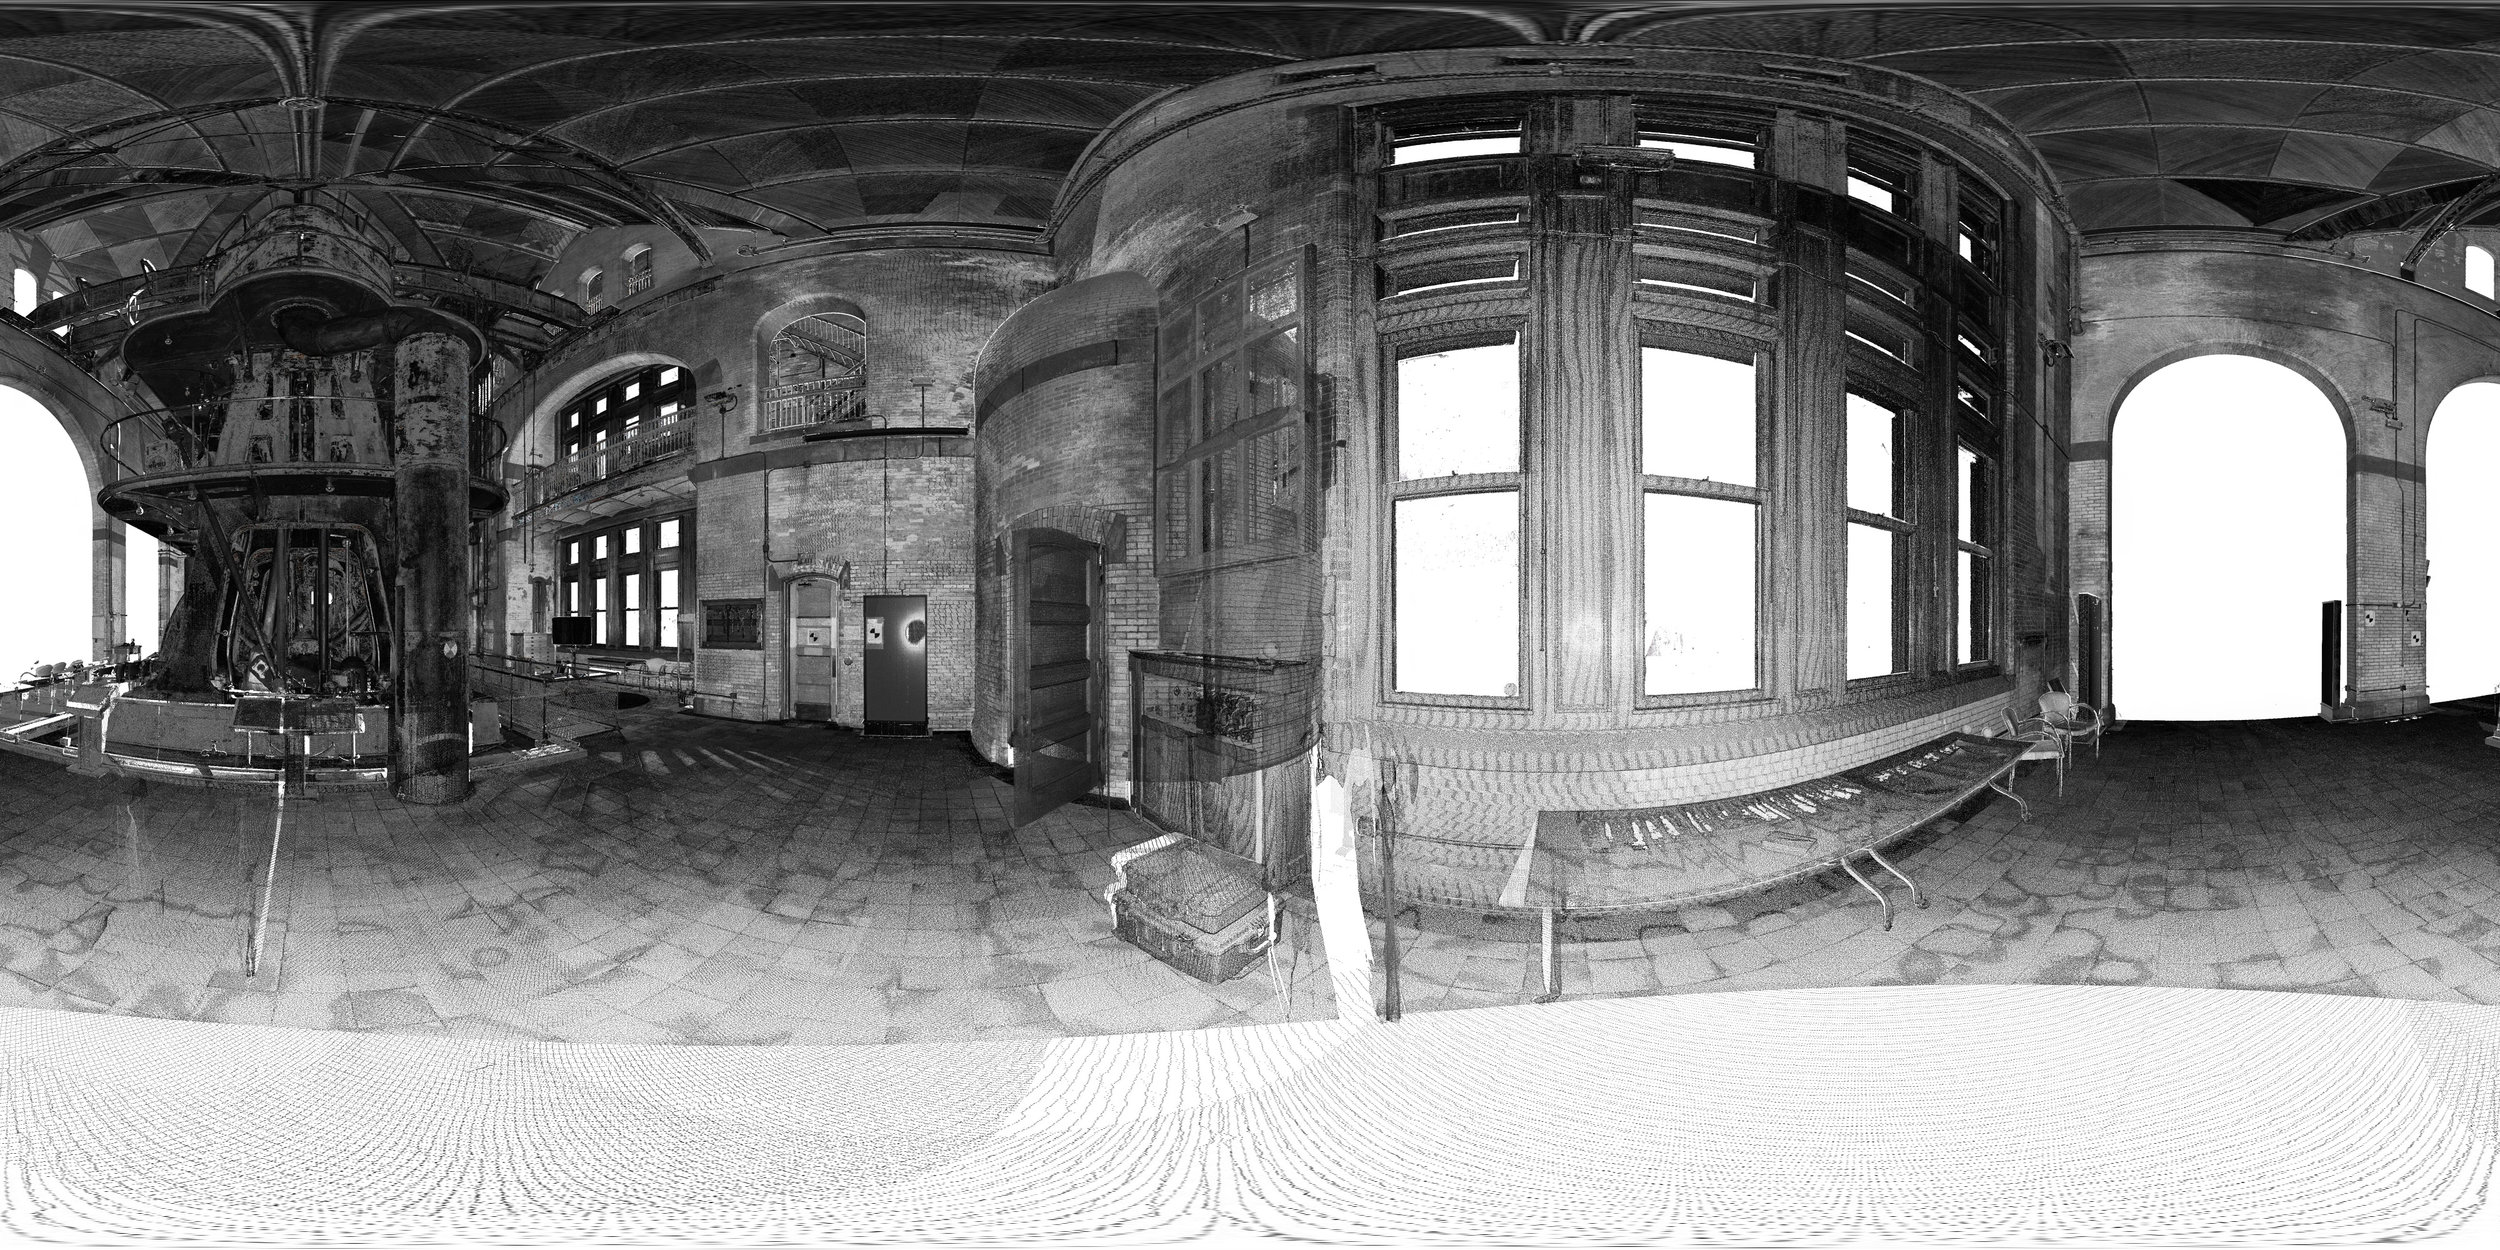
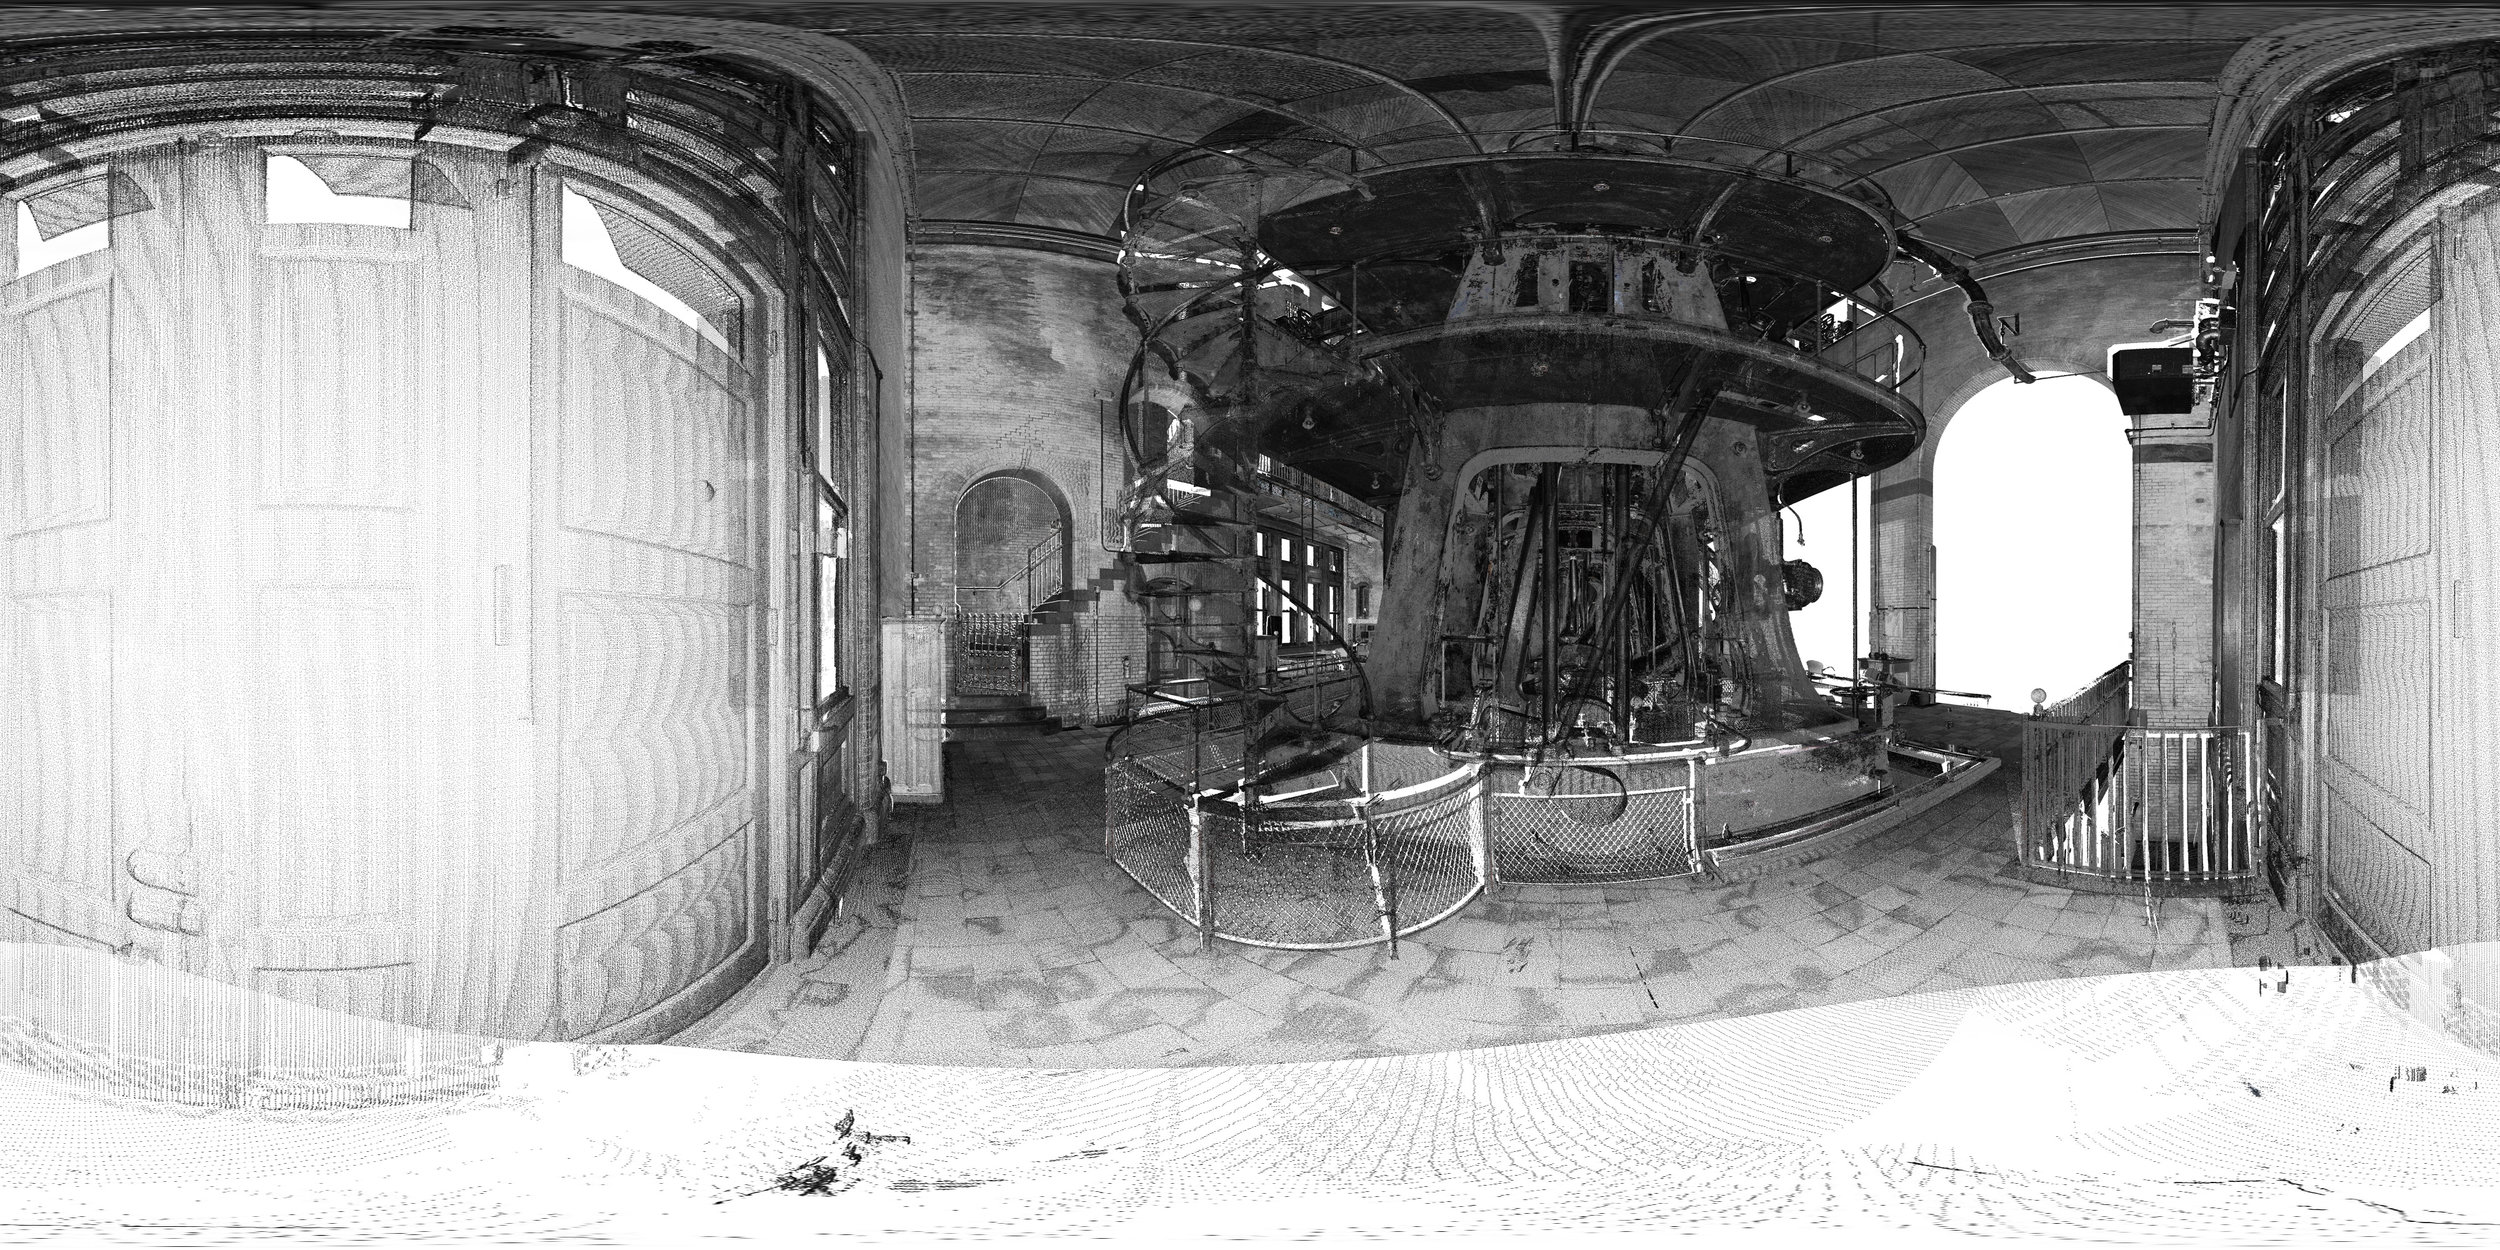
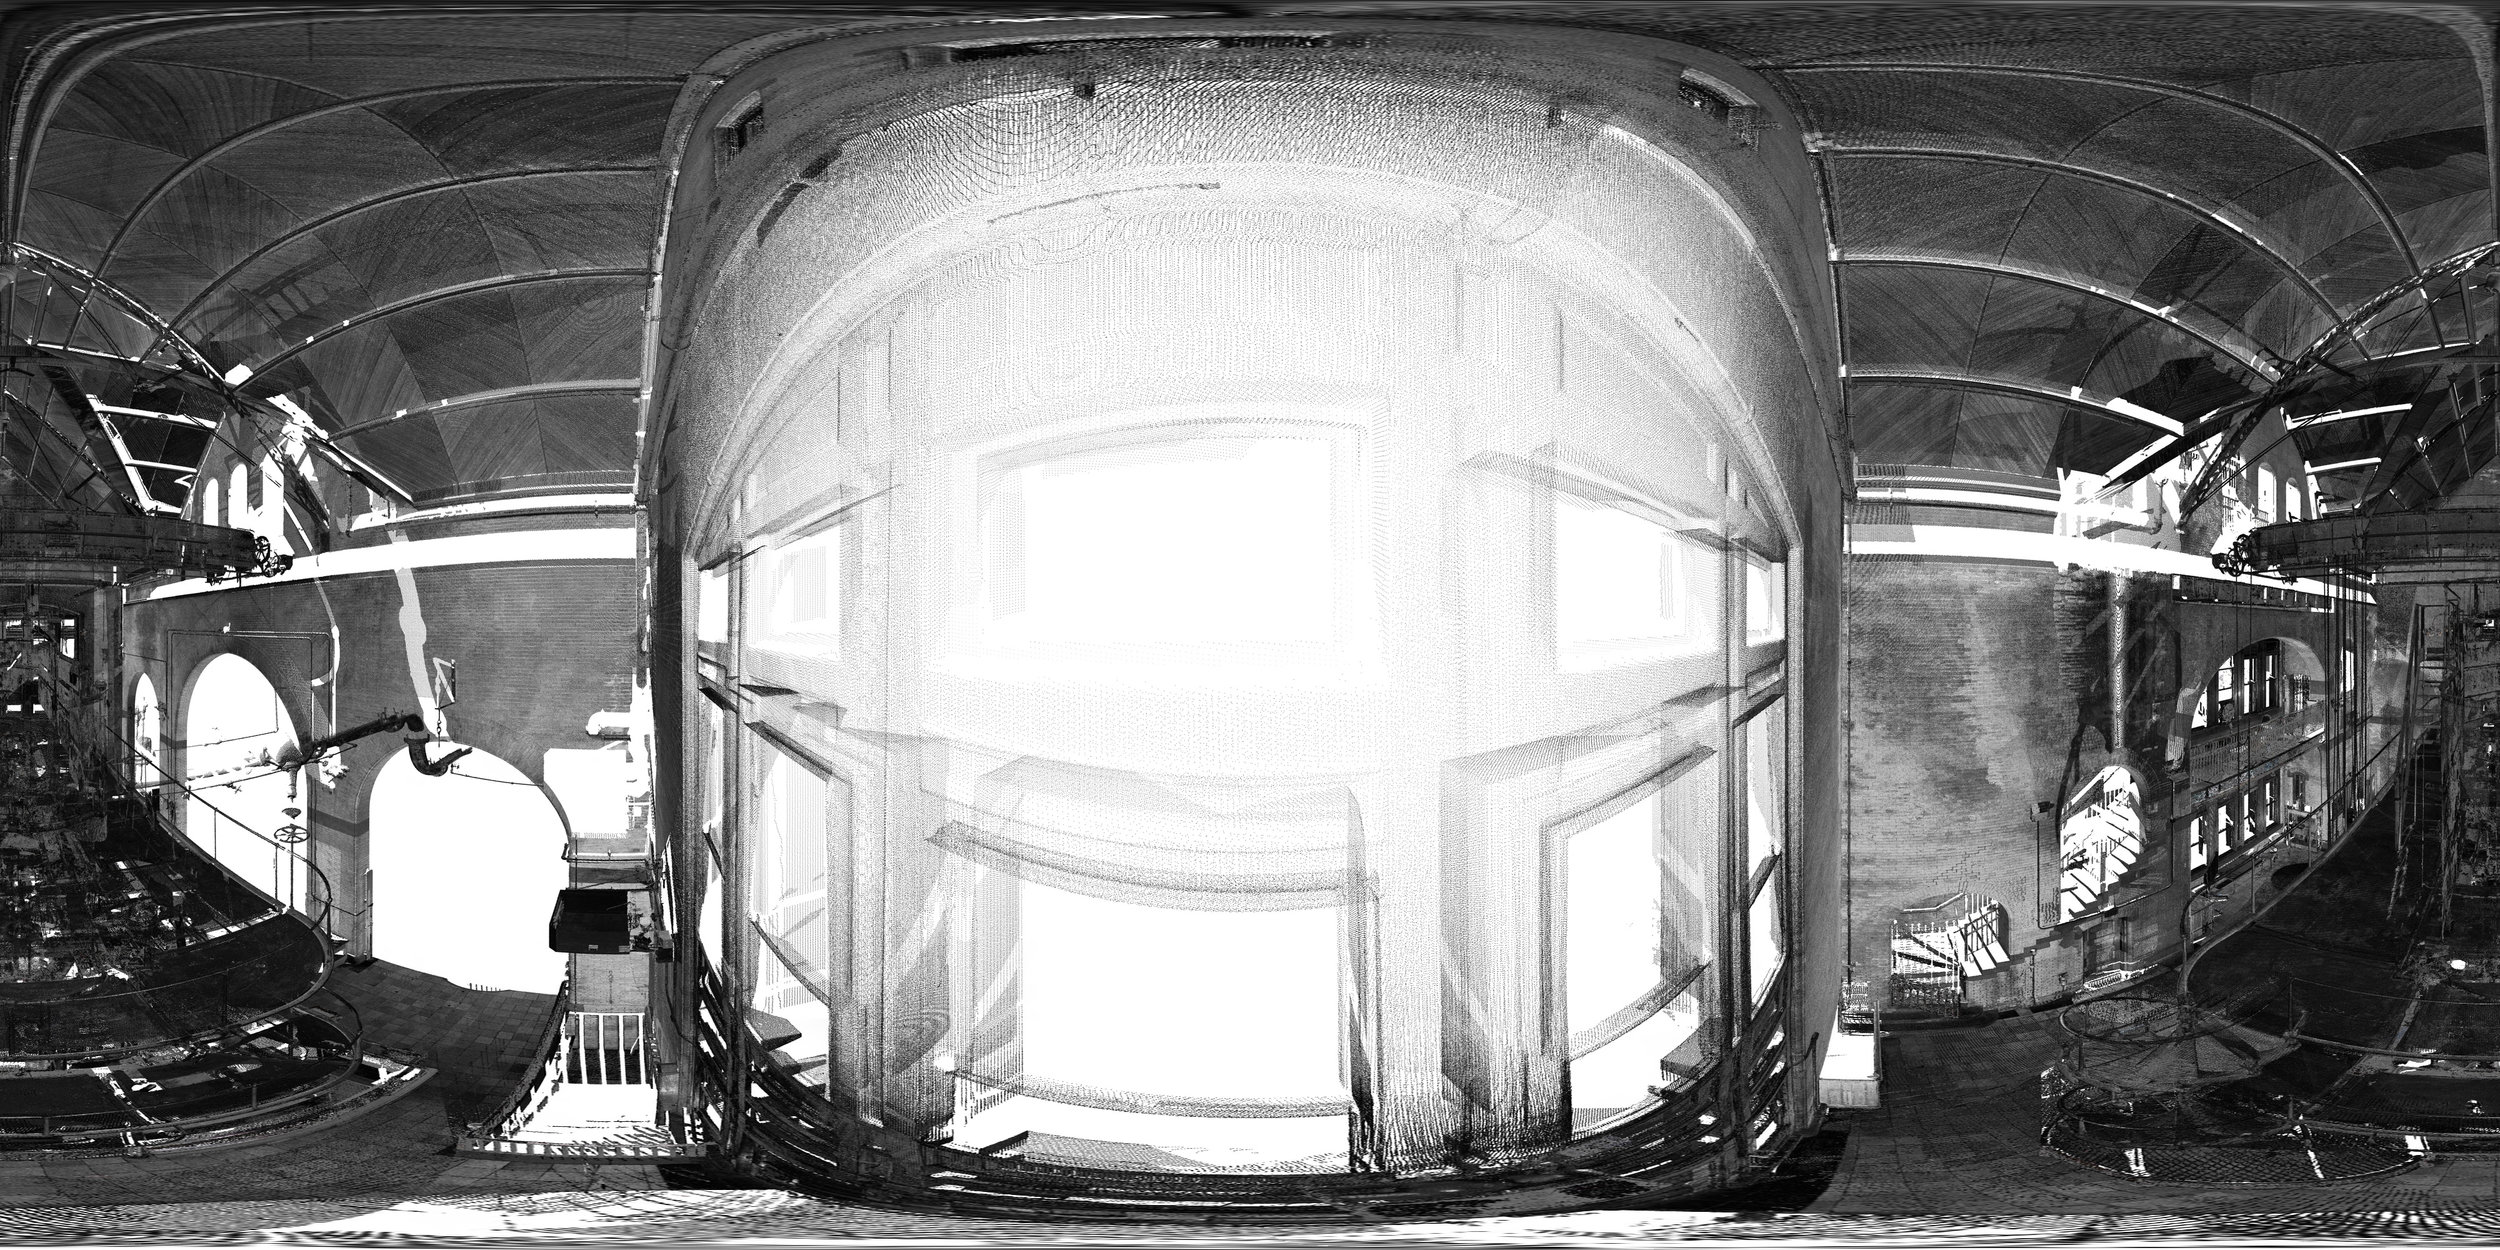
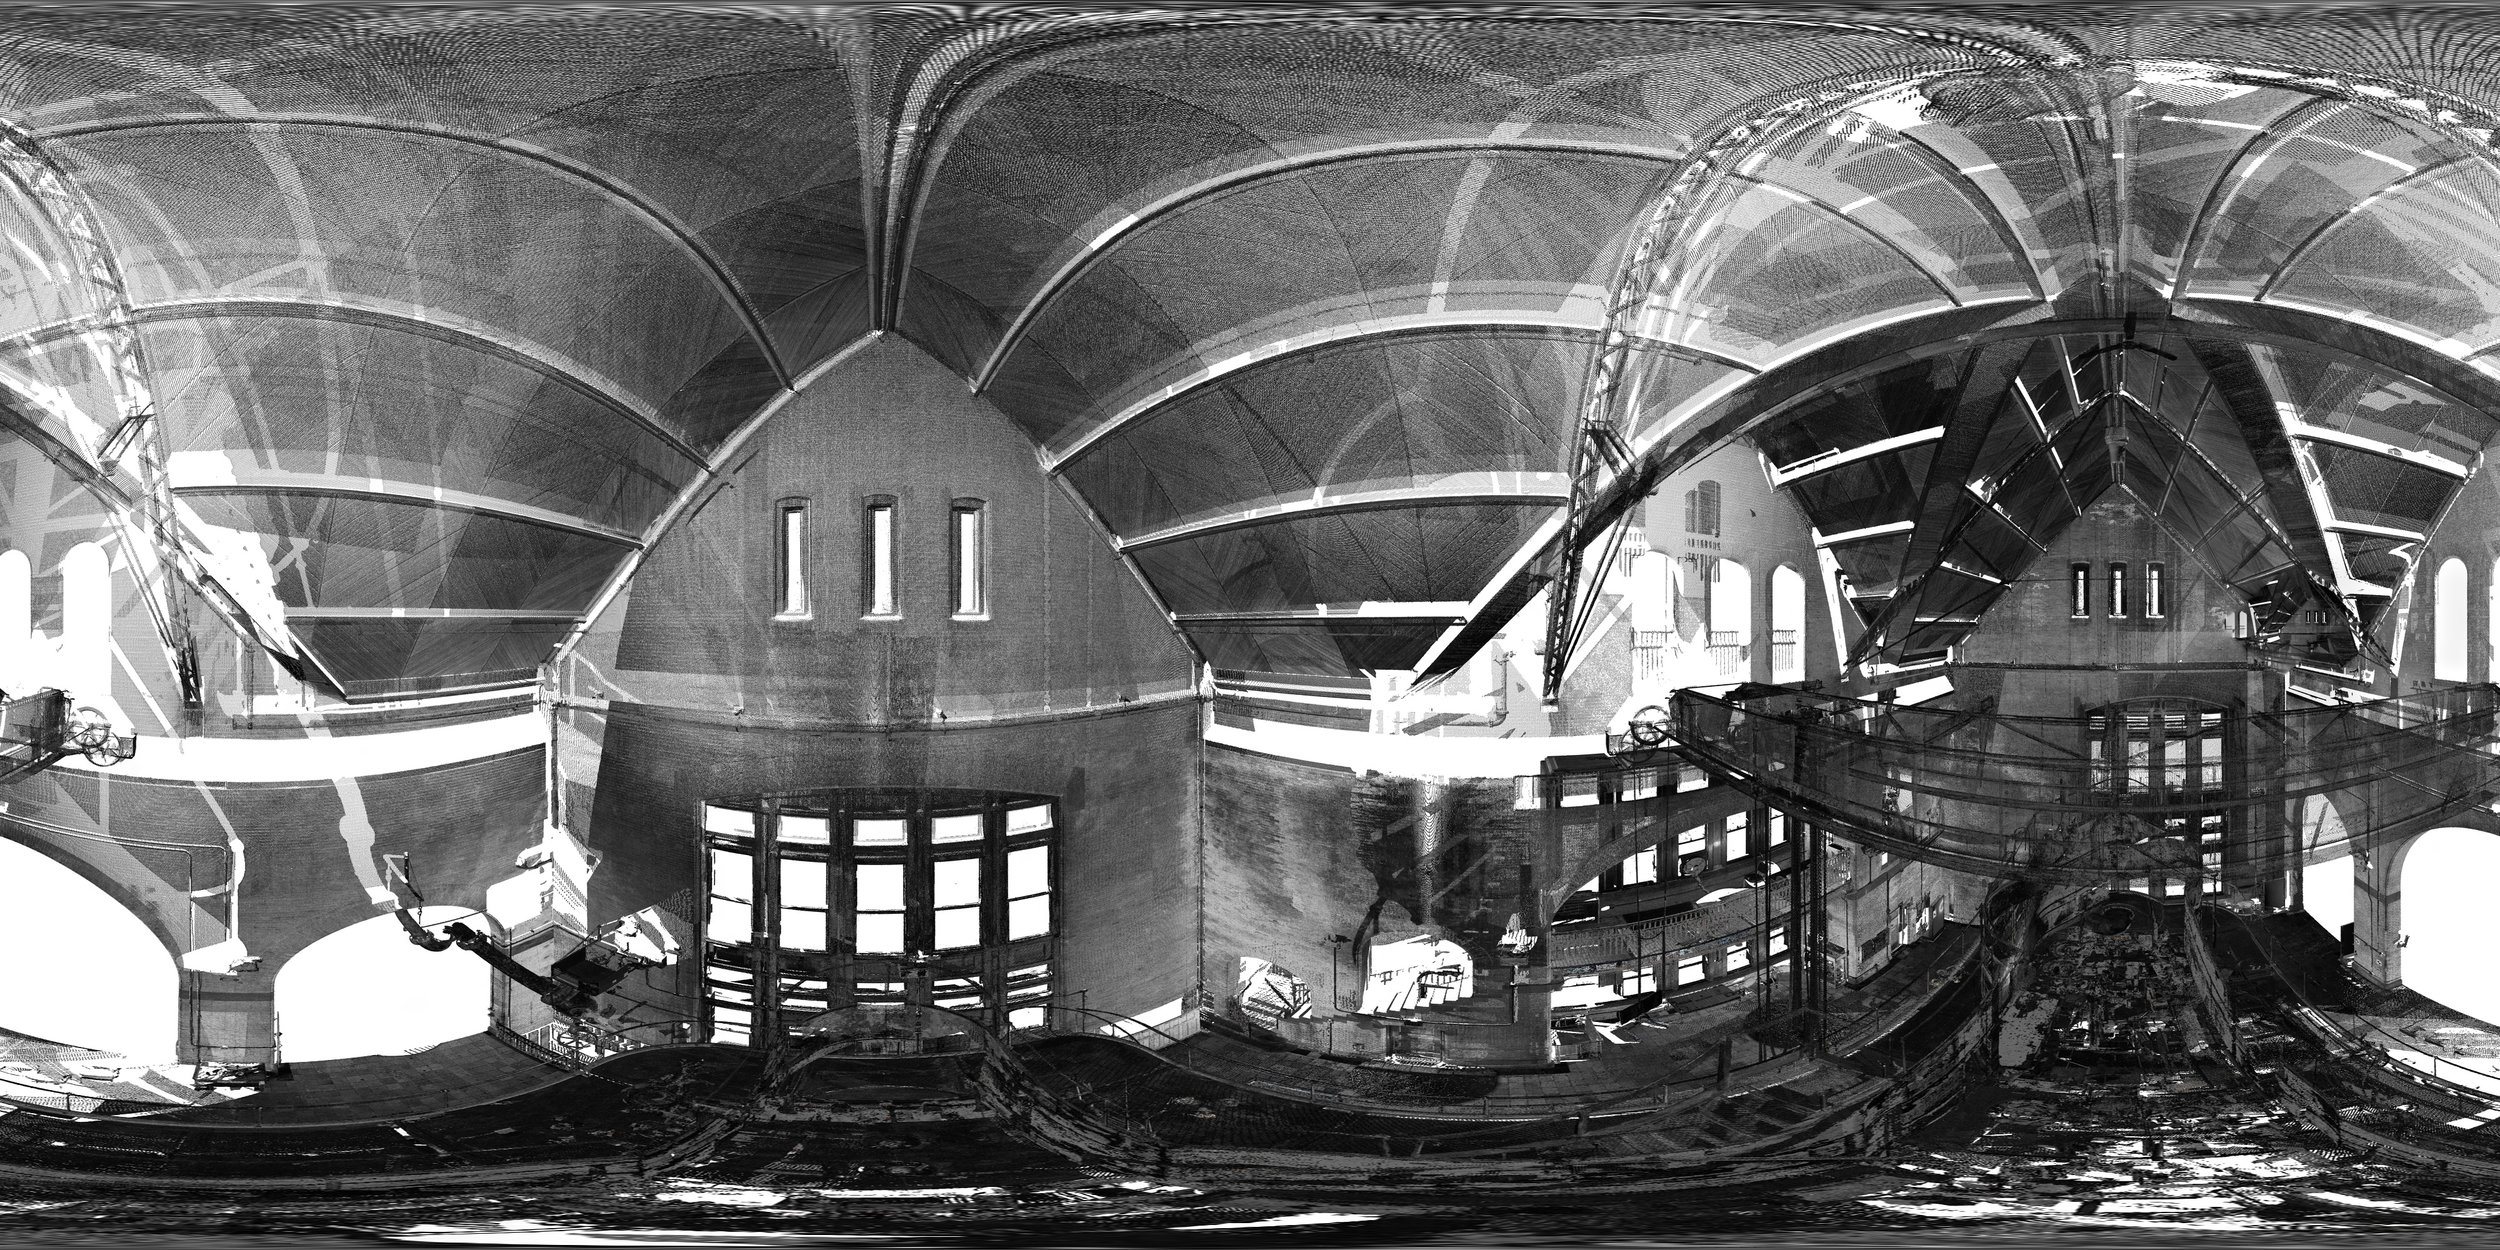
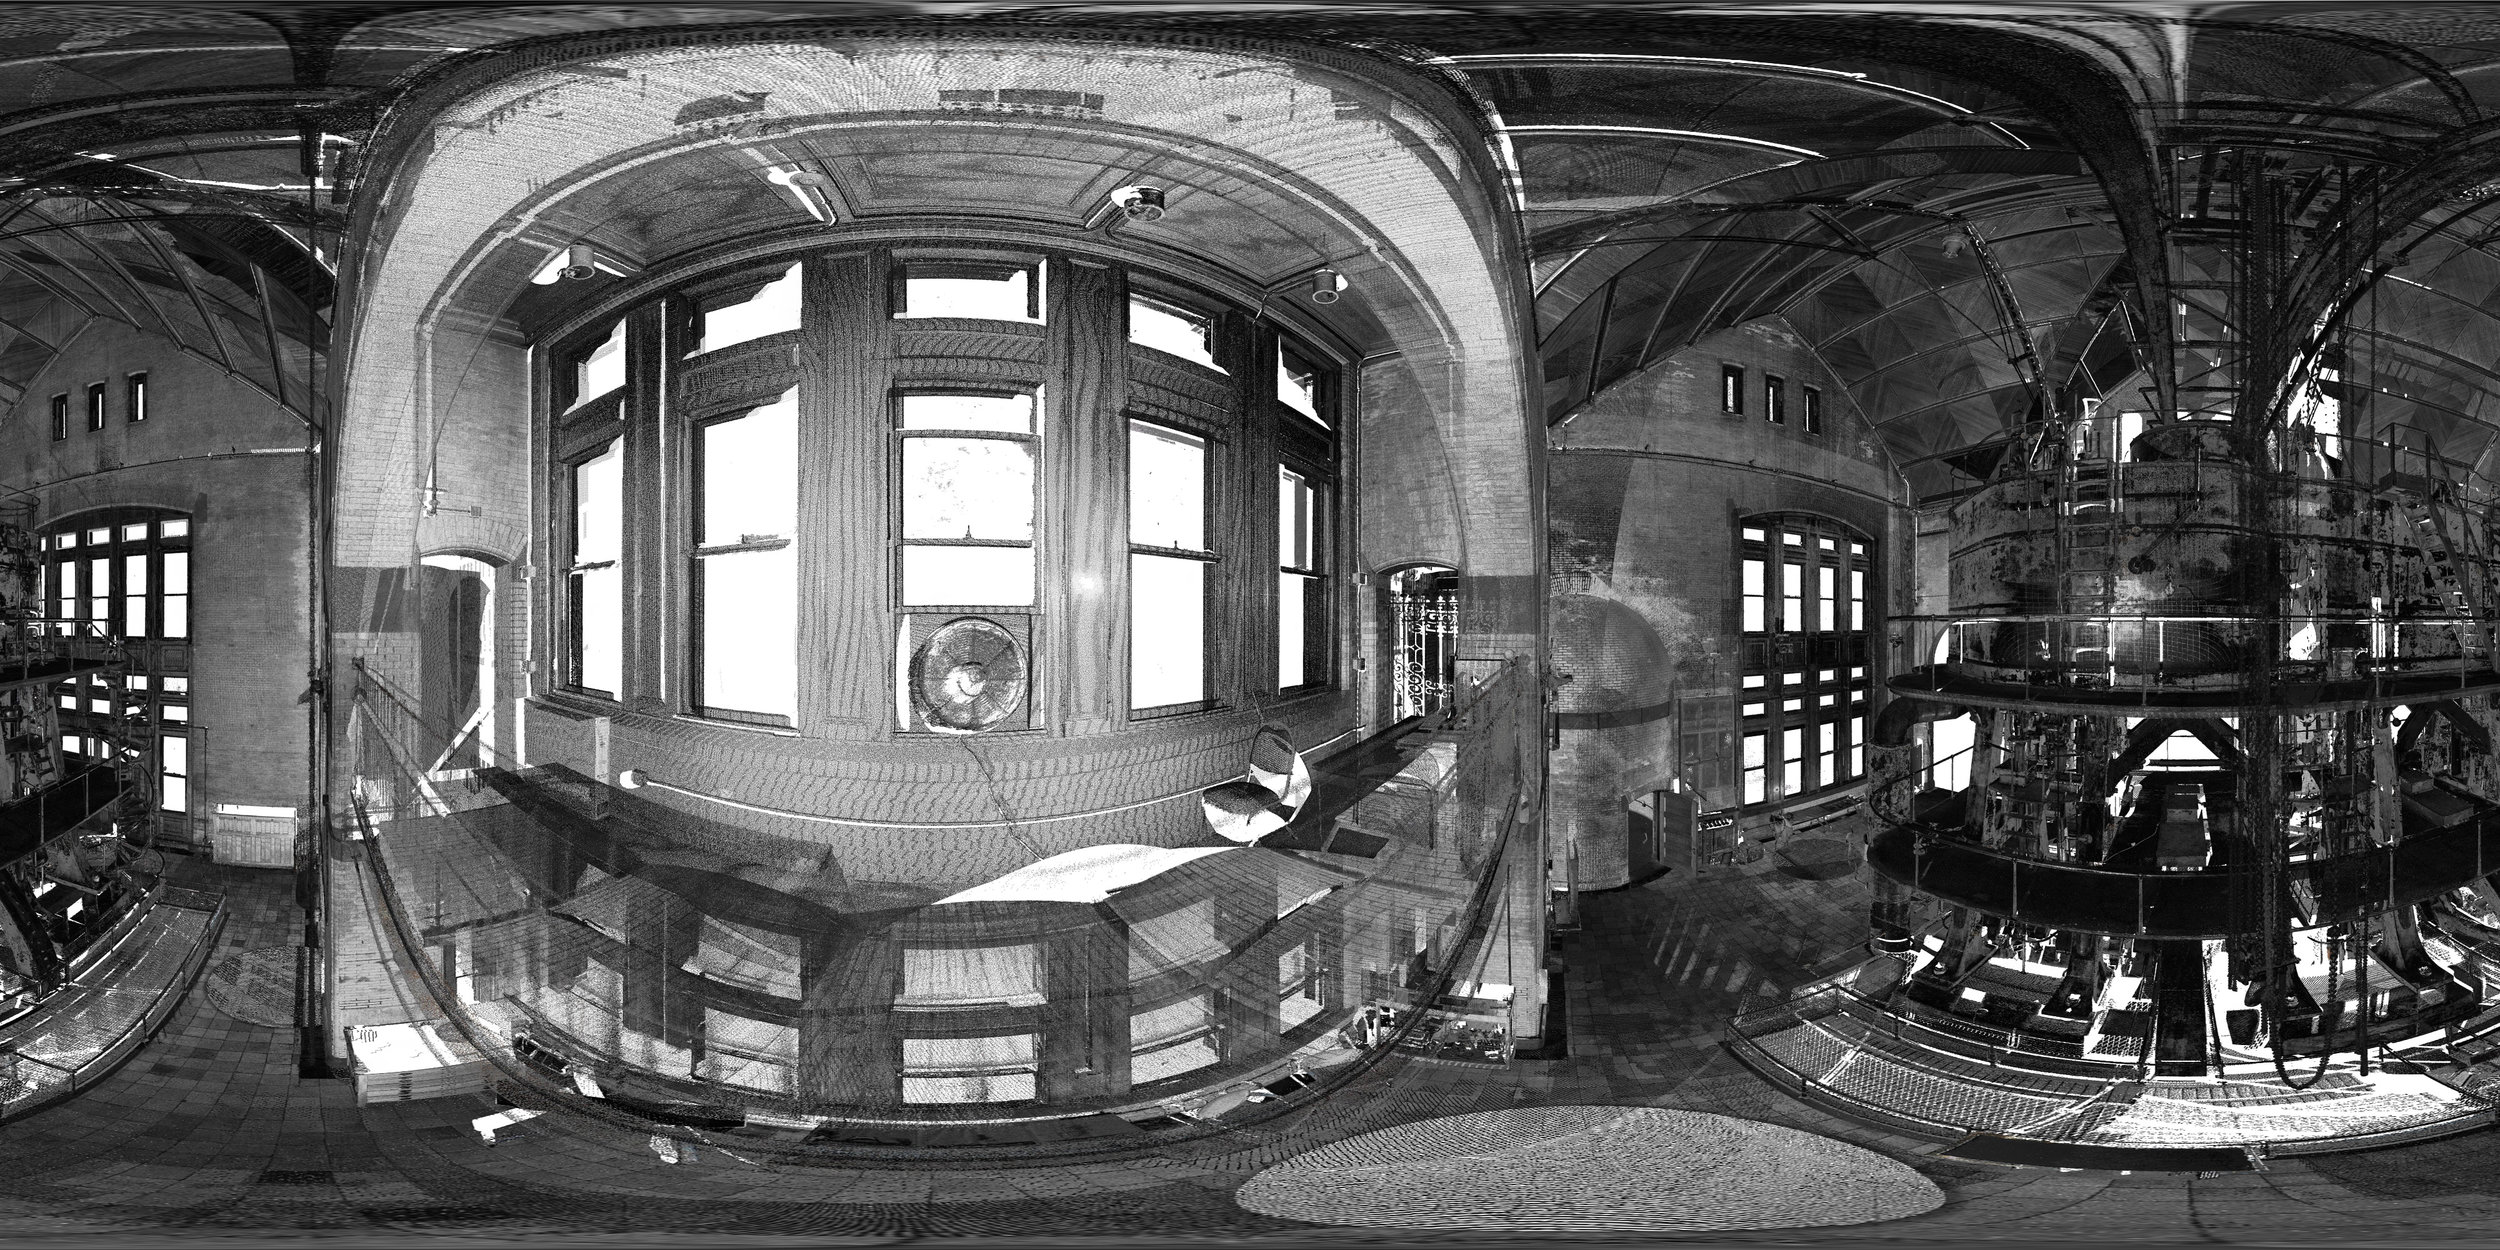
LIDAR (also termed Light Directional Ranging) stands for Light Radar and uses a highly sensitive laser range finder to record the position of millions of points in space from a single location. Each point has its location (XYZ) and color (RGB) catalogued so that a data set of XYZ-RGB Points can be compiled into a digital Point Cloud
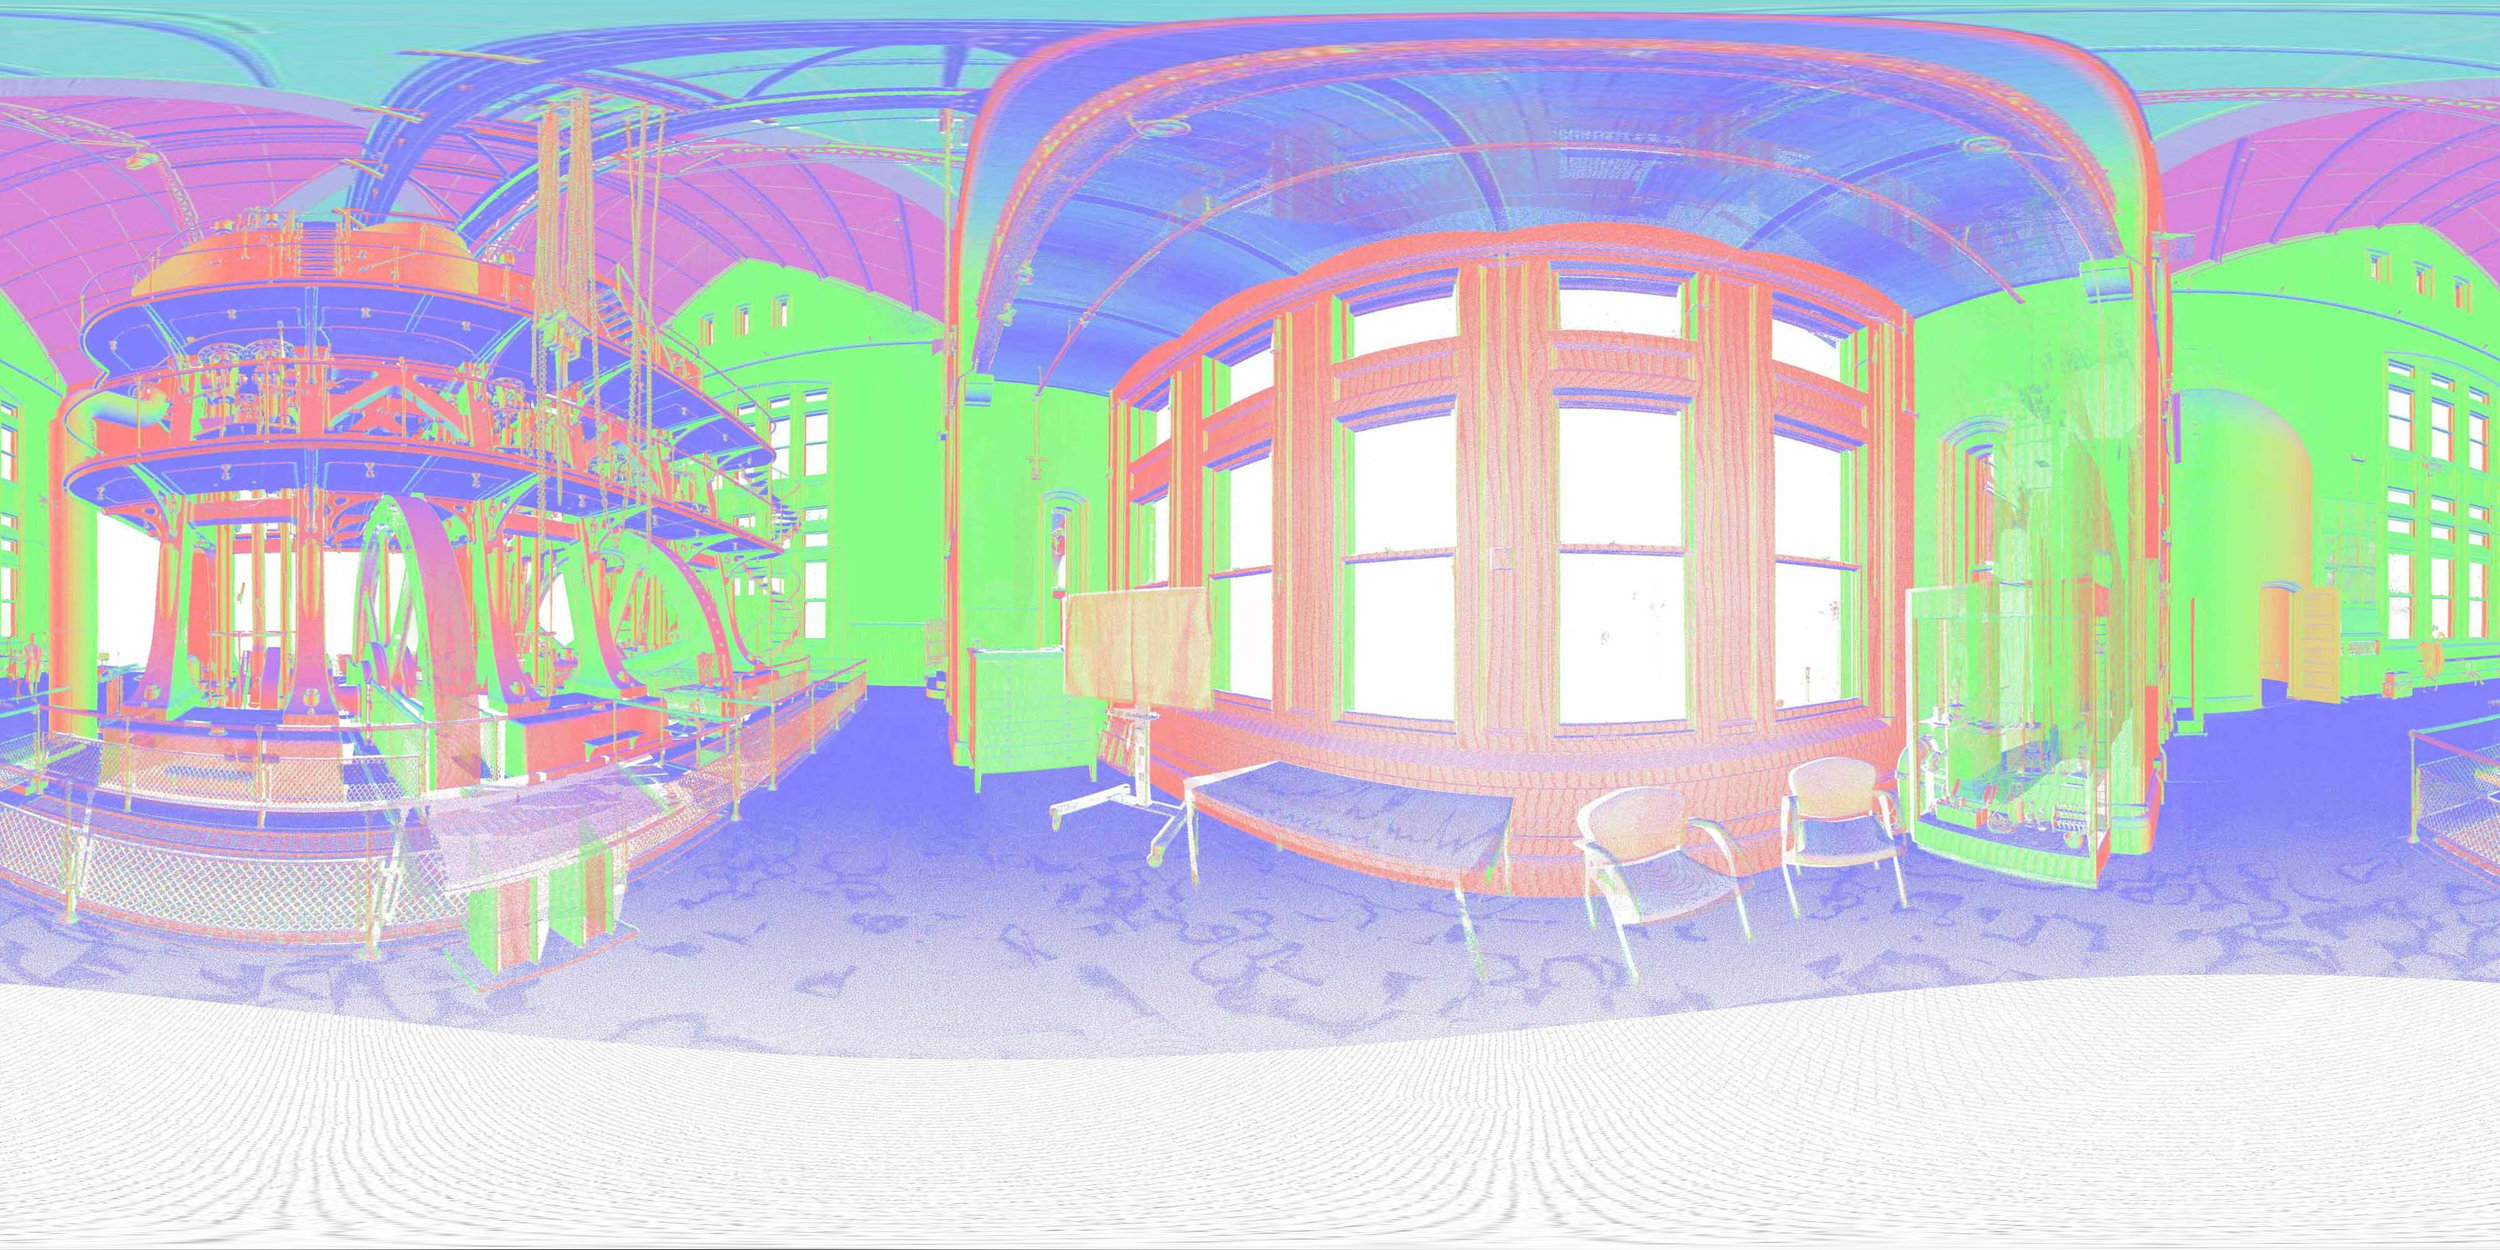
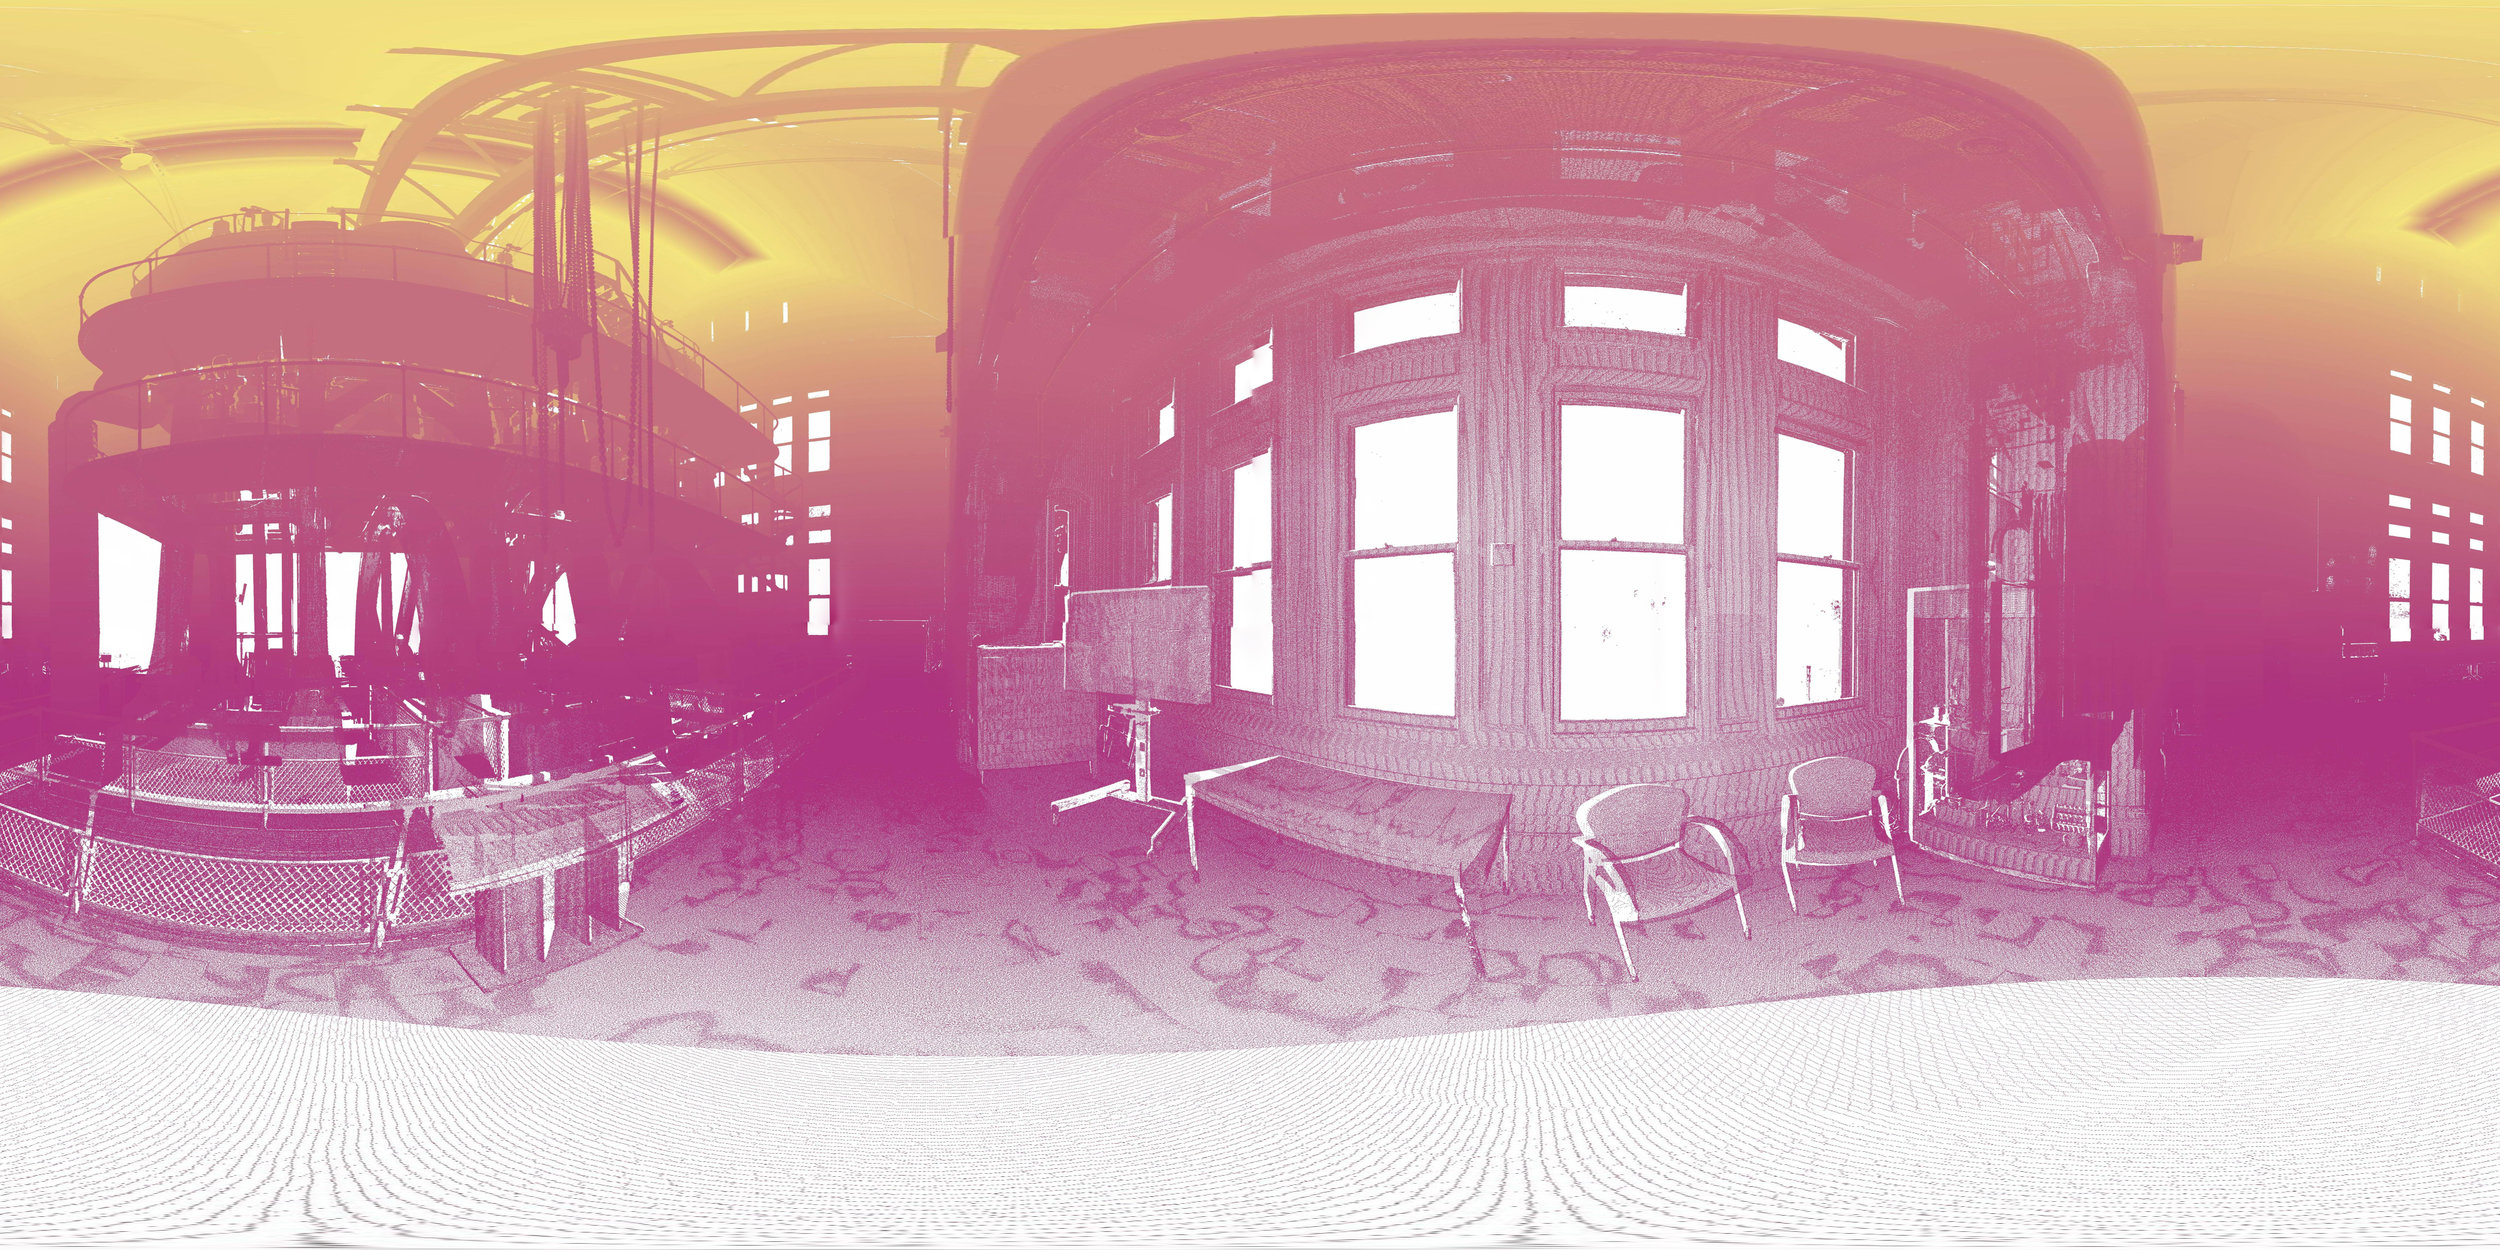
Point Clouds are special, because they provide a highly precise record of a scanned space’s geometry, as well as high-resolution pictorial detail of a space’s color and texture. This makes LIDAR a natural tool for creating highly precise records of historic spaces. Shown here are four views that utilize the LIDAR scans multiple recording modes to reveal more spatial depth and detail than is available to the natural eye.
The three-dimensional nature of the LIDAR scan also enables us to explore portions of the space that are difficult to access. The Metropolitan Waterworks Museum Pump Hall provides an excellent example of cavernous space that is rendered with extraordinary detail, making it possible to explore the ceiling boards between rafters without a lift.
Explore these drawings more in VR by uploading the images below to Oculus 360